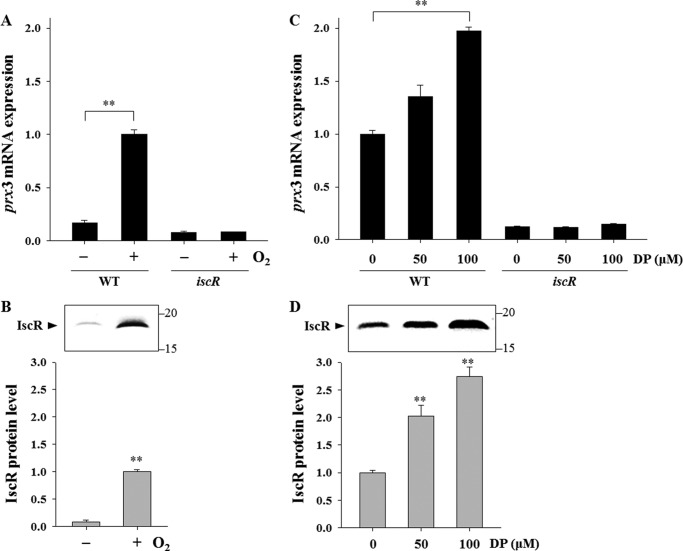
FIGURE 11.
Effects of oxidative stress and iron starvation on the IscR activity. Total RNAs and proteins were isolated from the wild type and iscR mutant grown anaerobically or aerobically to an A600 of 0.3 (A and B) or from the strains grown aerobically to an A600 of 0.3 after being exposed to various concentrations of DP for 10 min as indicated (C and D). A and C, the prx3 mRNA levels were determined by qRT-PCR analyses, and the prx3 mRNA level in the wild type grown aerobically was set to 1. B and D, protein samples were resolved by SDS-PAGE, IscR was detected by Western blotting, and results are presented as described in the legend to Fig. 10. In the graph, the IscR protein levels were calculated based on the band intensities, and the IscR protein level in the wild type grown aerobically was set to 1. Error bars, S.E. **, p < 0.005 relative to the strains grown anaerobically (A and B) or to the strains unexposed to DP (C and D). −, grown anaerobically; +, grown aerobically.

