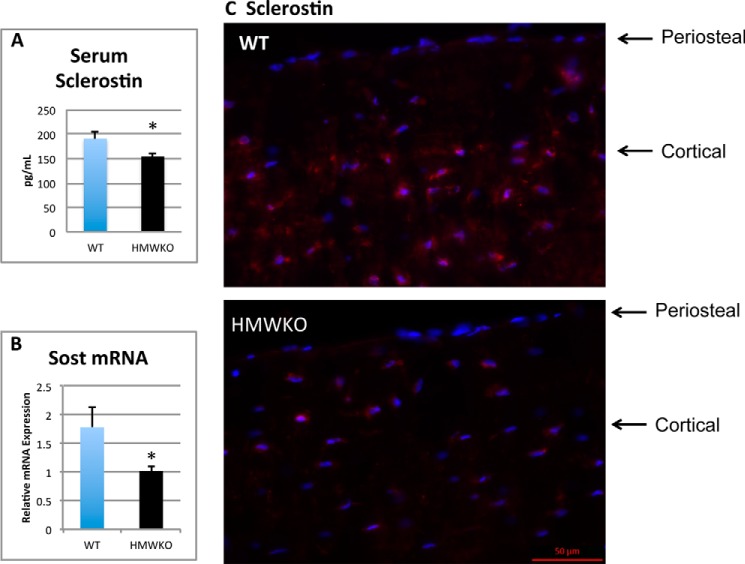
FIGURE 11.
Decreased serum sclerostin and decreased Sost mRNA and protein in bones of HMWKO mice compared with WT. A, serum sclerostin. B, RT-PCR Sost mRNA. C, representative immunofluorescent images for sclerostin expression in femurs. Decreased sclerostin expression (red) in osteocytes of cortical bone in HMWKO compared with WT. Nuclei were counterstained with DAPI (blue) (serum n = 10–11). * indicates significantly different from WT (p < 0.05).

