
FIGURE 9.
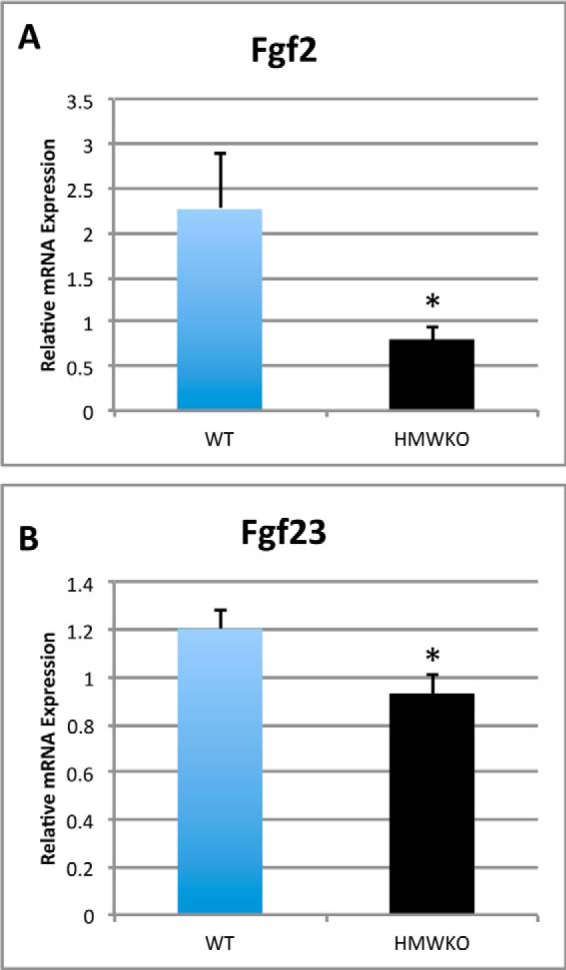
Modulation of Fgf2 and Fgf23 mRNA in HMWKO bones. Shown is real time RT-PCR analysis of Fgf2 (A) and Fgf23 (B) mRNA expression in flushed tibial bones (n = 7–11). * indicates significantly different from WT (p < 0.05).
Official websites use .gov
A
.gov website belongs to an official
government organization in the United States.
Secure .gov websites use HTTPS
A lock (
) or https:// means you've safely
connected to the .gov website. Share sensitive
information only on official, secure websites.
Modulation of Fgf2 and Fgf23 mRNA in HMWKO bones. Shown is real time RT-PCR analysis of Fgf2 (A) and Fgf23 (B) mRNA expression in flushed tibial bones (n = 7–11). * indicates significantly different from WT (p < 0.05).