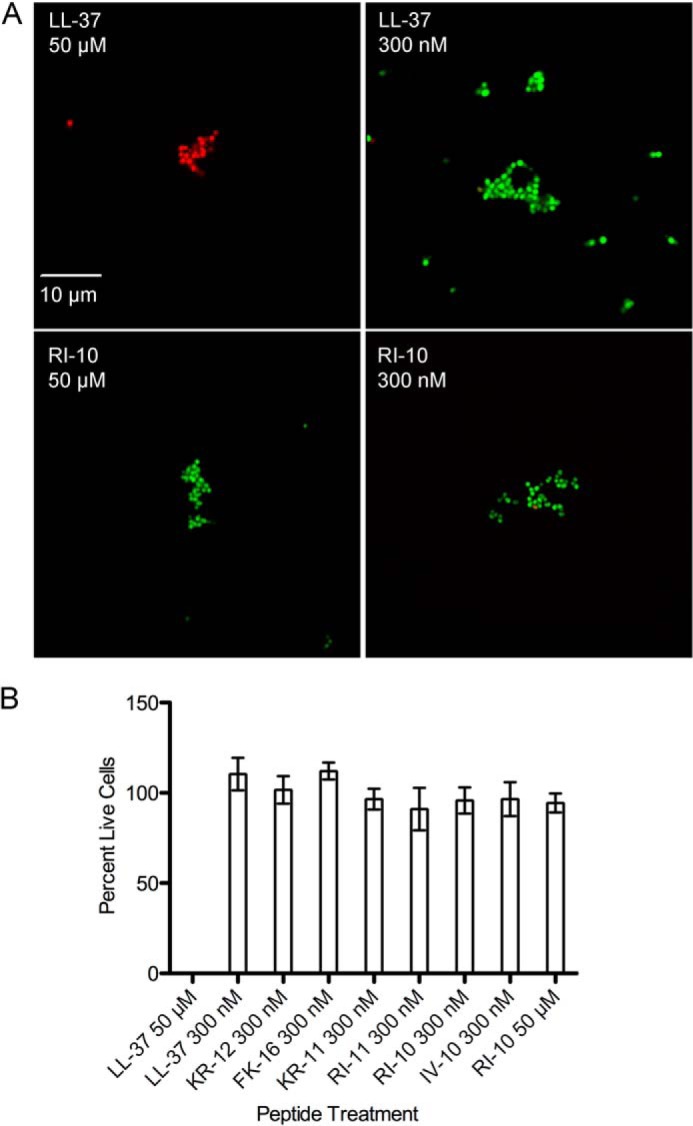
FIGURE 3.

GAS membrane damage by antimicrobial peptides. A, fluorescence microscopy of GAS after exposure to antimicrobial peptides in 0.5× PBS for 1 h followed by staining with SYTO 9 (green, penetrates intact cell membranes) and propidium iodide (red, stains cells with membrane damage). B, quantification of cell viability by fluorescence measurement in a microplate fluorometer and comparison with a standard curve of different ratios of live/dead bacteria.
