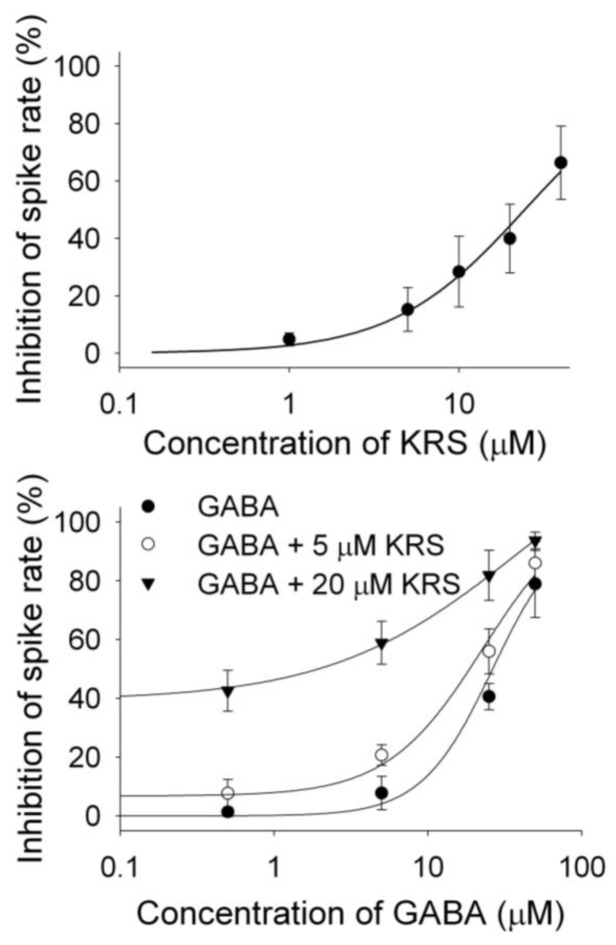
Figure 11.
The concentration–response curves of KRS-5Me-4-OCF3–evoked inhibition and of GABA in the presence of KRS-5Me-4-OCF3. (A) The KRS-5Me-4-OCF3–evoked change in spiking rate was normalized to the control condition, and then averaged. Each point was the mean value ° SEM of 4 to 7 cells. The line is fit for the data to the Hill equation: y = Y0 + Axn/(Kdn + xn), where y is the inhibition of spiking rate, Y0 is minimal inhibition, A is maximal inhibition, Kd is the apparent dissociation constant for agents, and n is the Hill coefficient. Kd and n were estimated using a Marquadt nonlinear least-squares routine. (B) Shift of the concentration–response curves of GABA in the presence of KRS-5Me-4-OCF3 at different concentrations (0, 5, 20 μM). The lines are fits for the data to the above Hill equation. From [18].

