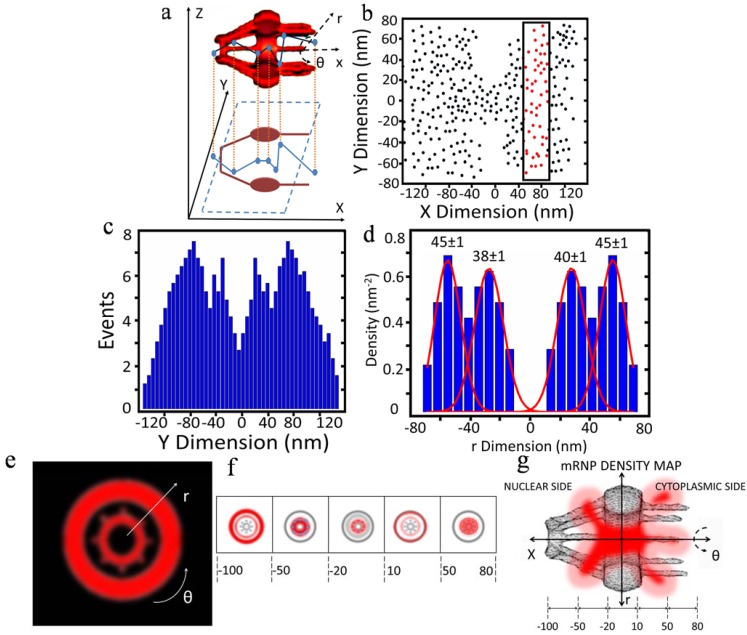
Figure 4.
Cartoon representations of 3D data generated with SPEED microscopy. (a) Plot of the interaction sites of a molecule (mRNP in this example) in the NPC, showing 3D spatial locations of a single tracked molecule projected (x, y, z) onto a 2D representation of the NPC. The 3D spatial locations are described via cylindrical coordinate system (r, θ, x). Coordinate x represents the location along the NPC axis, whereas (r, θ) refers to the positions at the cross-section of the NPC; (b) 2D plot of events from many molecules tracked. The x and y dimensions are shown in nanometers. The 2D spatial locations of events within the NPC are spatially divided into sections proceeding along the axial direction. One section is highlighted and will be further analyzed in this example; (c) Histogram of the section of the plot highlighted in (b), showing spatial locations of events in the y dimension; (d) Corresponding histogram in the r dimension, obtained by deconvolution process, showing major peaks shown by Gaussian fitting; (e) Radial distribution (cross-sectional image) of the region in (d); (f) Radial distributions are assembled from all sections of the pore (demarcated relative axial distances from the centroid of the NPC shown in nm), to create (g) The five cross-sectional regions shown in (f) are assembled to generate a spatial density map (cutaway view shown; r, θ, x dimensions; demarcated relative axial distances from the centroid of the NPC shown in nm). After Ma et al. [29] and Goryaynov et al. [9].

