Figure 1.
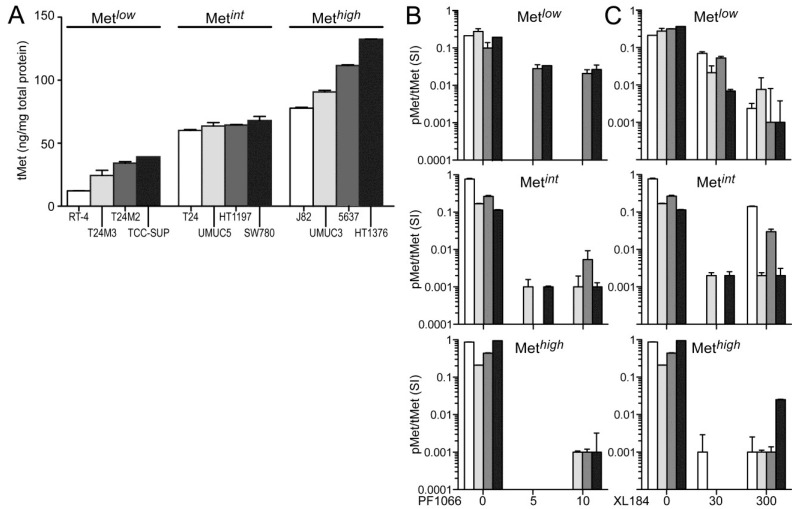
Total and phospho-Met content in UC-derived cell lines. (A) Cell types indicated were serum-deprived overnight before extraction with non-ionic detergent and measurement of total Met protein abundance by electrochemiluminescent immunoassay. The 12 cell lines were divided into three groups by Met abundance: low (Metlow), intermediate (Metint) and high (Methigh). Met abundance in each subset is further indicated by bar grayscale intensity from least (white) to most (black); this bar color scheme is in all figures except 6D; (B,C) Serum-deprived cells were treated with (B) 5 nM or 10 nM of crizotinib (PF1066) or (C) 30 nM or 300 nM of cabozantinib (XL184) for 20 min, followed by concurrent 20 min exposure to HGF (1 nM). Phospho-Met (pMet) in cell lysates was measured by two-site electrochemiluminescent immunoassay. Y-axis in log10; bars represent the mean of triplicate samples ± standard deviation (SD) and are representative of three independent experiments. Some error bars are too small to be visible.

