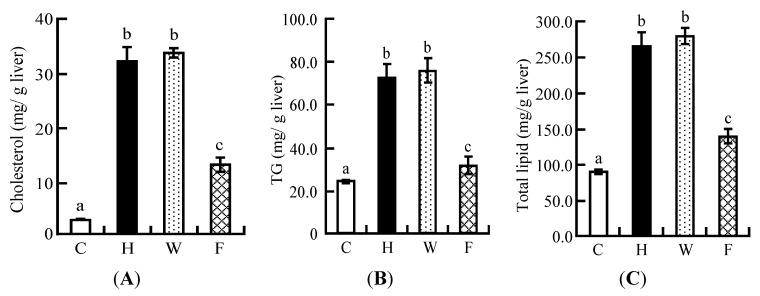
Figure 4.
Liver parameters of rats fed on the experimental diets for five weeks in Experiment 2: (A) hepatic cholesterol; (B) hepatic TG; (C) hepatic total lipid. Each value is the mean ± SE for eight rats. a, b, c Means not sharing a common superscript differ significantly according to Tukey’s multiple-comparison test (p < 0.05).

