
Figure 6.
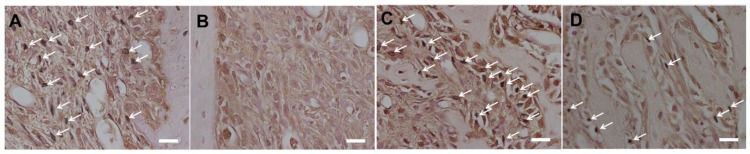
Photographs of alveolar socket stained with 8-OHdG (Scale bar = 20 μm). Photographs of upper region are shown (A: 3-days control group; B: 3-days experimental group; C: 8-days control group; D: 8-days experimental group). 8-OHdG-positive cells were stained brown (white arrows). Expression of 8-OHdG in the upper region was lower in the experimental group than in the control group at 3 and 8 days.