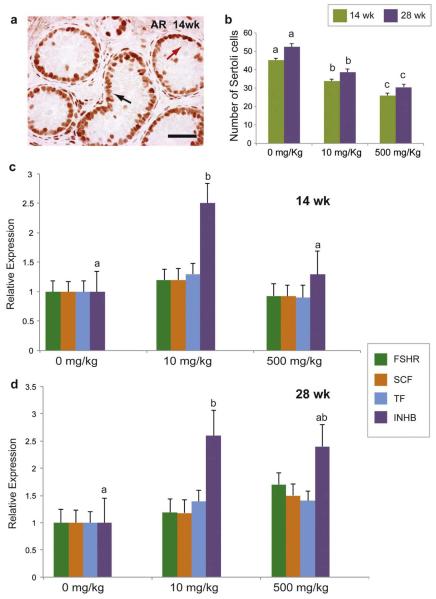
Figure 3.
Sertoli cell maturation and function in testis xenografts from mice treated with different doses of DBP. a) Immunohistochemistry for AR in testis xenografts treated with 0 mg/kg of DBP for 14 weeks. Black arrow shows AR-positive Sertoli cells while red arrow shows AR-negative germ cells; b) Number of Sertoli cells (AR-positive) per tubule cross-section; c) Relative expression of several genes associated with the function of Sertoli cells in xenografts at 14 (c) and 28 weeks (d). Different letters between bars of the same color indicate statistical difference (P<0.05). Scale bar = 50 μm.

