
Figure 5.
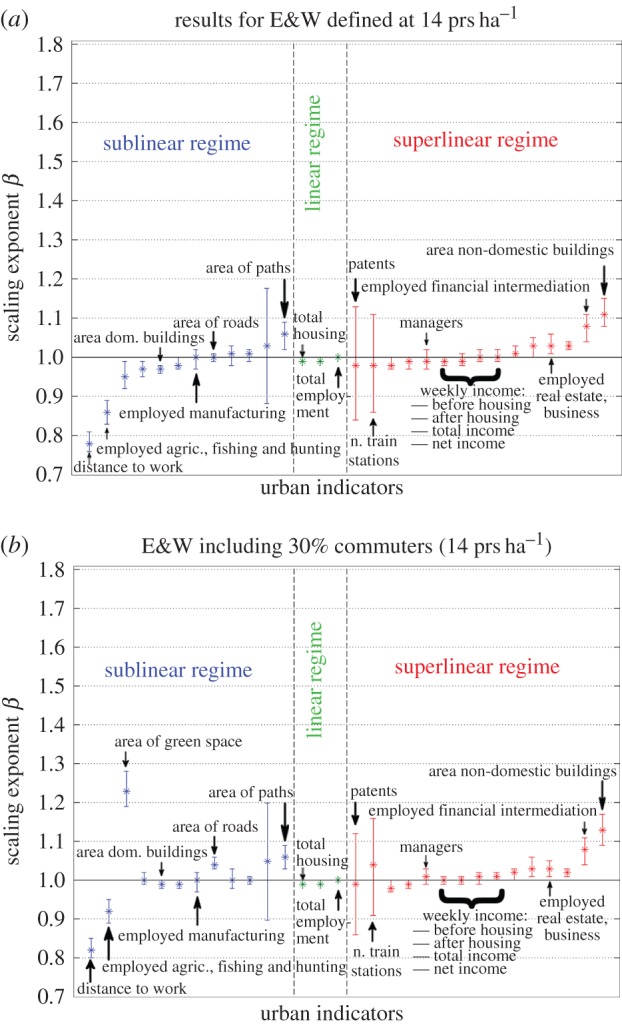
Scaling exponents with 95% CI for different urban indicators for cities defined at cut-off of ρc = 14 prs ha−1 in E&W without commuters (a) and with 30% commuters (b). (Online version in colour.)
Official websites use .gov
A
.gov website belongs to an official
government organization in the United States.
Secure .gov websites use HTTPS
A lock (
) or https:// means you've safely
connected to the .gov website. Share sensitive
information only on official, secure websites.
Scaling exponents with 95% CI for different urban indicators for cities defined at cut-off of ρc = 14 prs ha−1 in E&W without commuters (a) and with 30% commuters (b). (Online version in colour.)