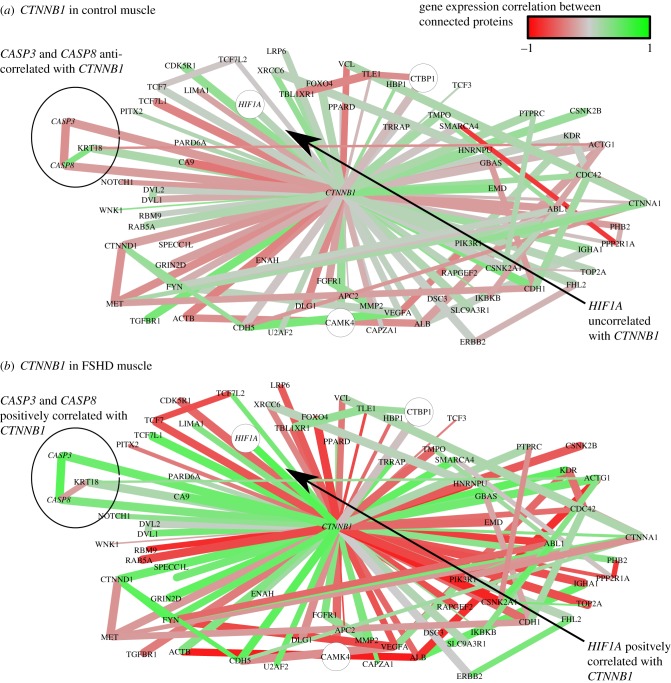
Figure 2.
The neighbourhood of CTNNB1 in the FSHD network. Interactions are coloured proportional to the Pearson correlation in gene expression between connected genes across control samples (a) and FSHD samples (b). Red edges are negatively correlated, grey edges uncorrelated and green edges positively correlated. The thickness of edges is proportional to 1 − p, where  is the p-value of the statistical analysis performed to determine whether correlation in gene expression between connected edges is different between FSHD and control. Large nodes belong to the core set of 164 high confidence FSHD-specific rewiring genes. Large circles indicate proteins significantly rewiring between FSHD and control phenotypes, identified in the second stage of InSpiRe. There is a clear shift from predominantly uncorrelated to highly correlated between FSHD and controls, with an increased correlation between CTNNB1 and its interaction partners across FSHD samples as compared with controls. This is indicative of increased β-catenin activity. Note the increased positive correlation between CTNNB1 and HIF1A, CASP3 and CASP8.

