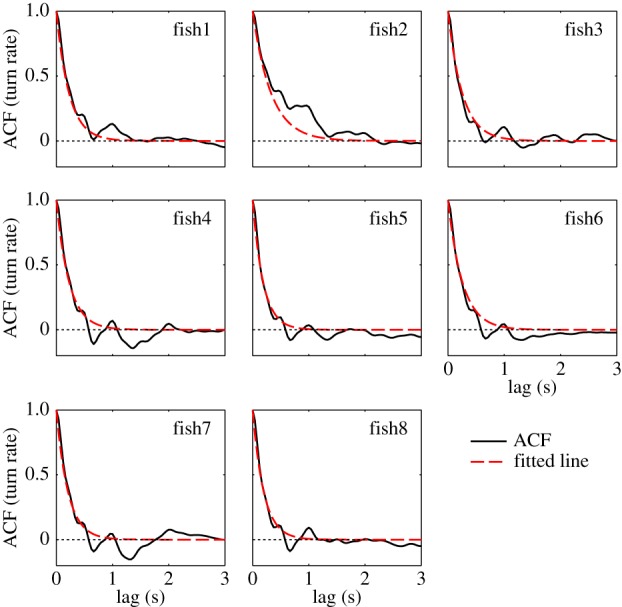
Figure 4.

Zebrafish turn rate autocorrelation. Computed autocorrelations of the turn rates of eight fish (in solid black) show an exponential decay toward zero. Red dashed lines indicate the best exponential fit, computed using a linear regression on the logarithm of the ACF in MATLAB. (Online version in colour.)
