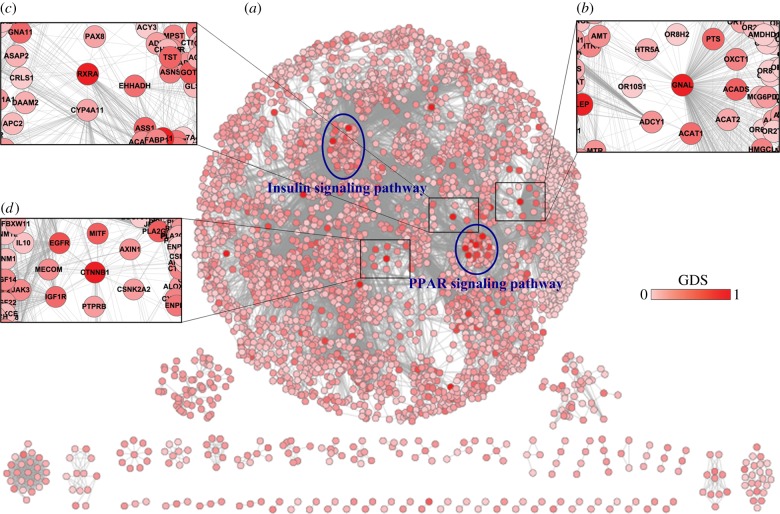
Figure 2.
Global gene–gene network. (a) Each gene was assigned a global dysregulation score calculated from the breast cancer dataset. The scale of the global scores ranged from 0 to 1, and genes with larger scores were marked with darker colour. Two blue ellipses correspond to the regions of the insulin signalling pathway and PPAR signalling pathway, respectively. (b–d) The zoom-in plots correspond to the regions around GNAL, RXRA and CTNNB1, respectively. (Online version in colour.)

