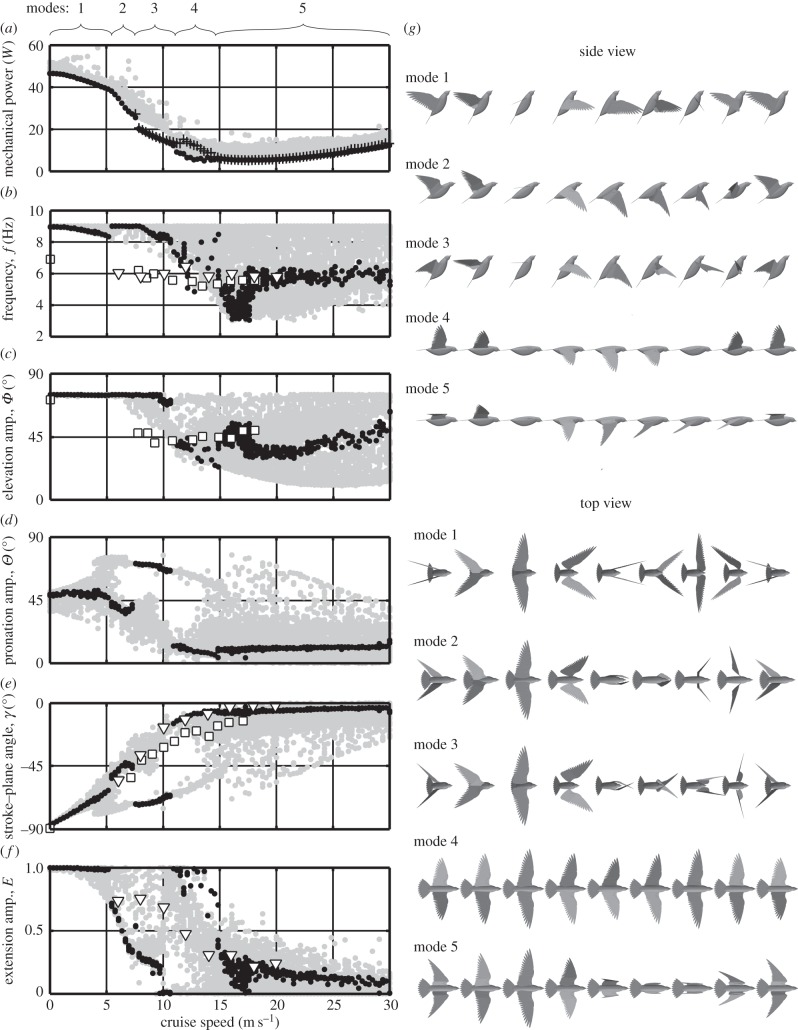
Figure 5.
Predicted wing kinematics of the pigeon at cruise speeds varying from 0 (hover) to 30 m s−1. (a–f) Filled circles are kinematic variables predicted through simulation; black dots are global and near-global solutions, that fall within 5% of the minimum power solution for a given cruise speed; grey dots are local solutions, which still satisfy the optimization constraints and therefore represent valid cruising kinematics, but use more than 5% of the minimum power solution for a given cruise speed. Crosses are the simulated power consumption for a control case when the model is constrained to an upstroke extension amplitude of E = 0.25. Square symbols are data from previous experiments, for which the current model used the same mass, wing planform geometry and body frontal area [37]. Triangular symbols are data from previous experiments on pigeons with a lower average body mass and wing length [41]. (g) Illustrations of kinematic modes 1–5 are global optimum solutions at cruise speeds of 2.7, 6.4, 9.1, 12.7 and 16.1 m s−1. Numerical data are included in the electronic supplementary material.

