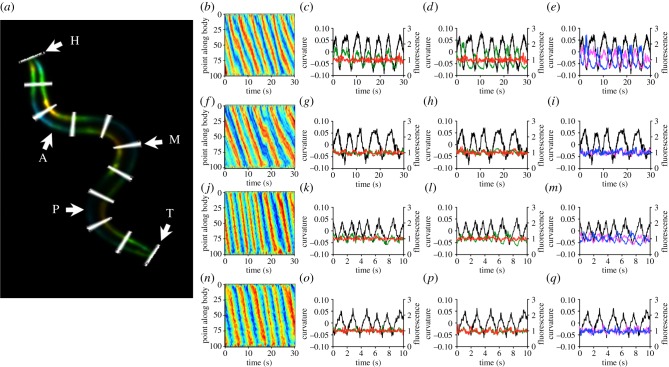
Figure 2.
Body wall muscle activity in freely crawling and swimming worms. (a) Image processing analysis. The body divided into 100 segments (H = head, segment 1; T = tail, segment 100; every 10th segment is highlighted in white) and midline curvature and dorsal and ventral fluorescence intensity is measured. Segments 25, 50 and 75 are selected to represent anterior, midbody and posterior muscle activity (A, M and P, respectively). Body wall fluorescence is coloured by curvature (reds, positive; blues, negative). (b) Body curvature kymograph during crawling. Red bands represent ventral bends; blue bands represent dorsal bends. (c) Ventral GCaMP (green) and tagRFP-T (red) fluorescence with curvature (black, ventral contraction positive). (d) As (c) but dorsal fluorescence. (e) Comparison of dorsal (blue) and ventral (magenta) fluorescence. (f–i) As (b–e) but for a control animal expressing GFP in place of GCaMP3. (j–m) Curvature kymograph during swimming (j), curvature and ventral fluorescence (k), curvature and dorsal fluorescence (l), and curvature with ventral and dorsal GCaMP3 fluorescence (m) in an animal swimming in 40% dextran, following figure 2b–e. (n–q) Same, but for a control animal expressing GFP in place of GCaMP3.

