Figure 3.
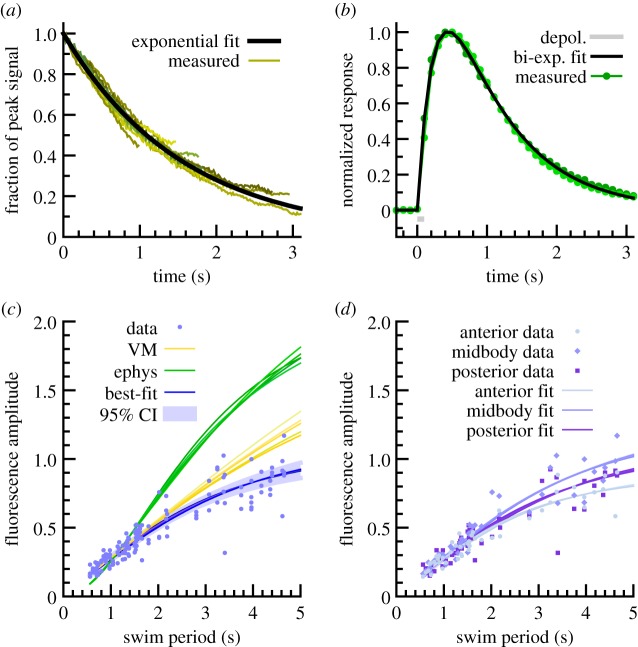
Estimation of signal filtering from GCaMP3 kinetics. (a) GCaMP3 fluorescence decays observed during rapid relaxation of vulval muscle, along with best single-exponential fit (time constant 1.57 s). (b) GCaMP3 signal induced by electrical activation of muscle (indicated in grey). Green, individual trials (n = 2). Black, best two-exponential fit, e−t/0.25 − e−t/0.88 (time units seconds). (c) Fluorescence amplitude as a function of locomotion period across all viscosities, plus crawling. Blue dots, raw data (n = 48 animals, three body positions each). Green lines, relationship expected from parameters found from electrophysiology with different assumptions about shape of underlying activation. Yellow lines, relationship expected from vulval muscle derived parameters. Blue lines, relationship expected with best fit of two-exponential filtering function, e−t/0.05 − e−t/0.50. Confidence interval determined by bootstrap resampling of data. (d) Amplitude–period relationship for anterior, midbody and posterior sites, plus best fits to each; differences are not statistically significant at this sample size.

