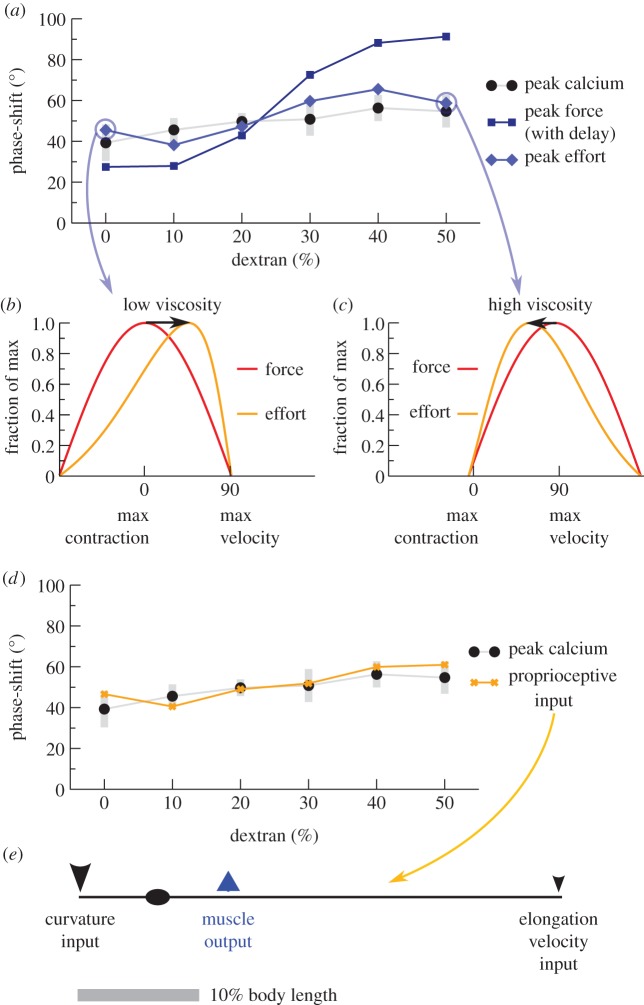
Figure 5.
Force–activity agreement with biophysically limited muscle. (a) Muscles with both force–velocity and force–length curves (light blue diamonds) are predicted to require maximal activation at phases similar to that inferred from calcium imaging (best-fit method, black circles; grey bars indicate 95% bootstrap CI), while a simple lag between activation and force generation cannot (dark blue squares). Peak effort is computed with two constraints: vpeak/vmax = 0.8 (fastest observed rate of contraction was 80% of the maximum biophysically possible under zero load), and Lnadir/Lmin = 0.62 (greatest observed contraction was 62% of the maximum possible, neglecting body elasticity). (b,c) Possible mechanism of phase conservation from biophysical limits. (b) At low viscosity (0% dextran), muscles near maximum possible velocity when animals are near-straight, requiring effort (orange) that peaks in advance of force (red). (c) At high viscosity (50% dextran), force (red) peaks near maximum velocity but effort (orange) peaks with a relative phase delay where muscles are more contracted. (d) A linear combination of locally sensed stretch and velocity (orange Xs) can match the observed phases of activation (best-fit method, black circles), suggesting that proprioception would be sufficient to generate the pattern. (e) Illustration of the sensing and output pattern of neurons in (d). Arrow size indicates relative strength of input. Note that many other similar configurations also match observed phases.

