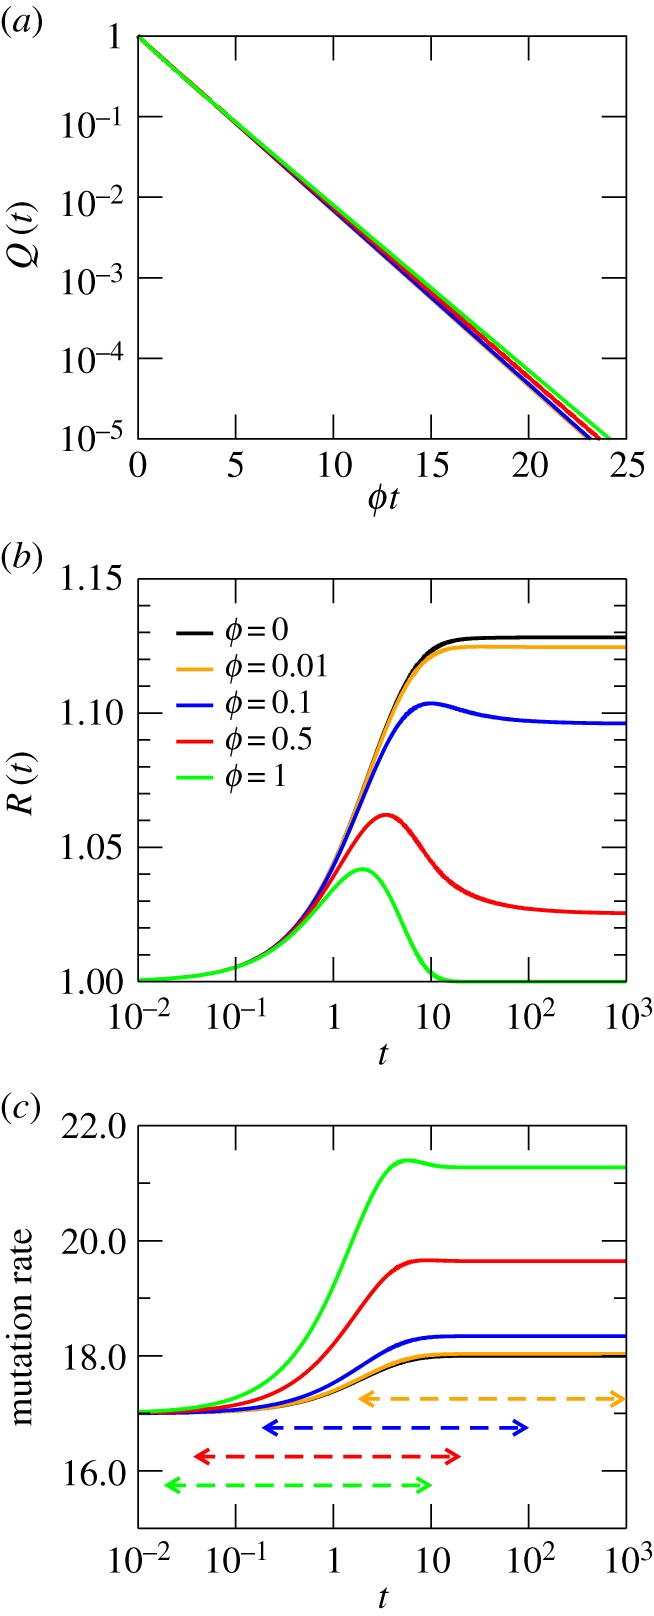
Figure 1.

Dynamics of RWs on an Erdös–Renyi random network with M = 20 000 nodes and average degree  . (a) Probability Q(t) that the RW stays on the network after a time t. (b) Overdispersion of the network. (c) Mutation rate or acceleration of the molecular clock. The time interval through which the number of trajectories remaining on the network decreases from 99% to 1% is represented as a horizontal dashed line limited by two arrows, with the same colour as the ϕ curve they correspond to. The same code is used in subsequent corresponding panels for other networks. The measured assortativity for this finite network is r≈0.018.
