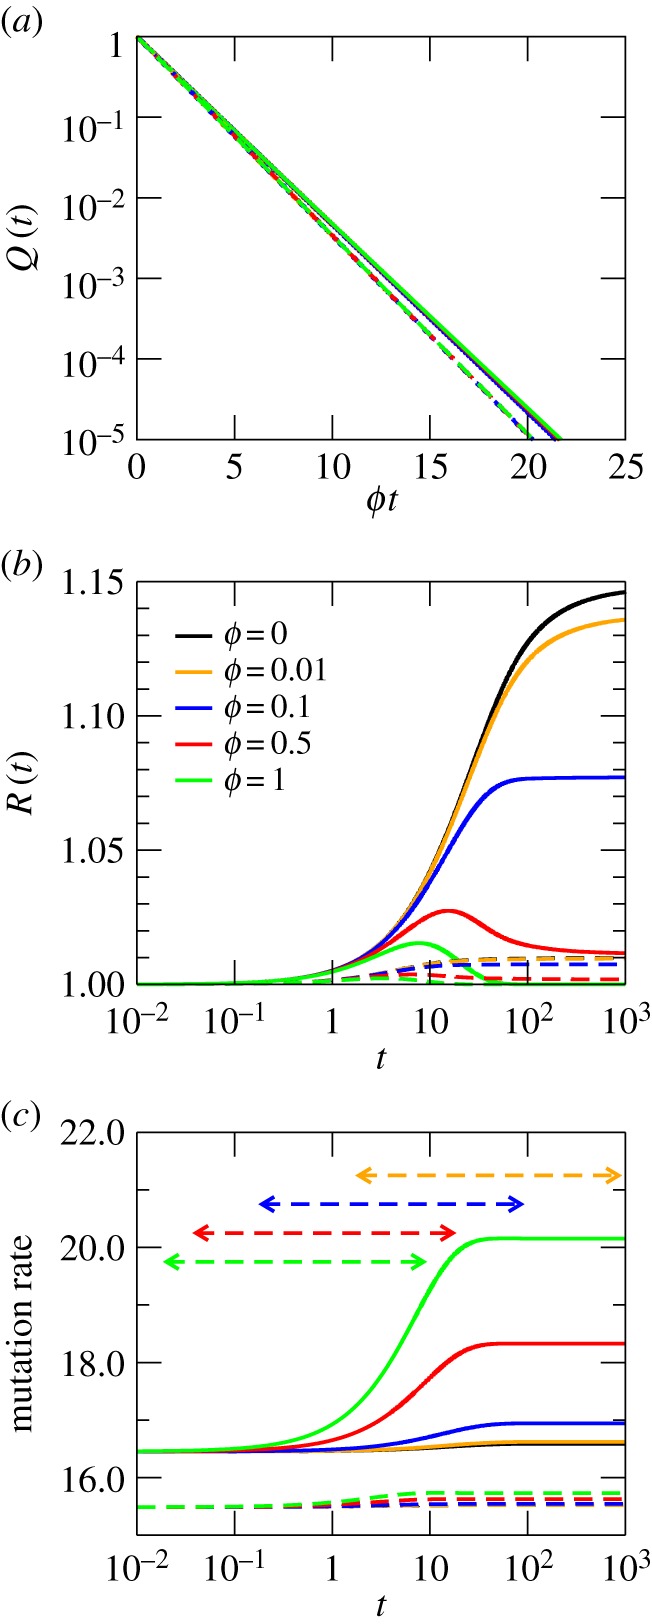
Figure 4.

Dynamics of a RW on two different RNA secondary structure NNs with z = 36. Sizes are M = 1965 (dashed lines) and M = 21 908 (solid lines). (a) Probability Q(t) that the RW stays on the network after a time t. (b) Overdispersion of the network. (c) Mutation rate. Times t1%(ϕ) and t99%(ϕ) are only shown for the largest network. The assortativity is r > 0.90. For the sake of comparison, these plots share scale with figure 1.
