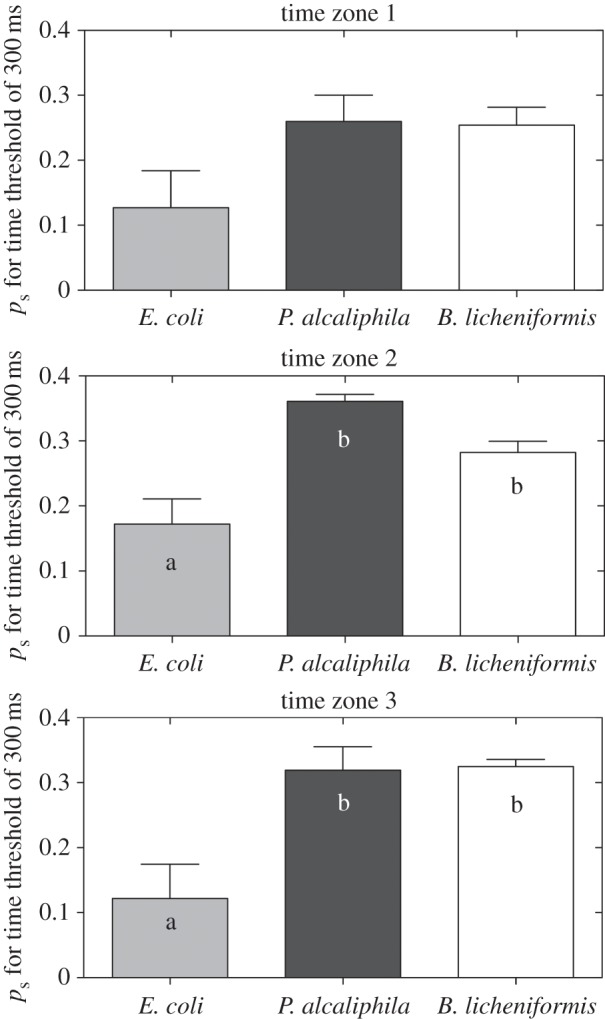
Figure 11.

Spatio-temporal (ps) quantification for cluster size C = 2 for Δt = 300 ms during the initial, middle and final growth phases (TZ1, TZ2 and TZ3, respectively). The values of ps were larger for biofilm-forming bacteria than for E. coli in TZ2 and TZ3, corresponding to the initial rapid growth phase and maximum biofilm formation, respectively. Means with the same letter are not significantly different (Tukey–Kramer test, p < 0.05).
