
Figure 3.
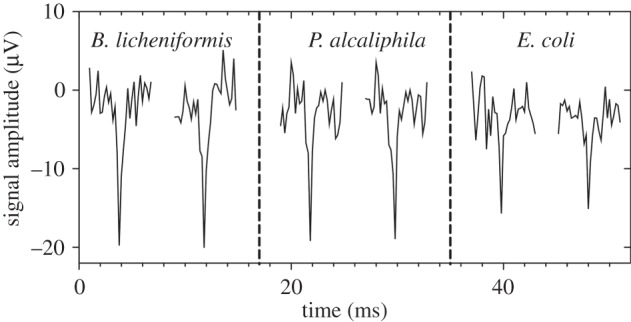
Recordings of action potentials in bacteria. Two traces for each strain are shown to illustrate the typical shape and size. The shapes are very similar, particularly for spike duration (approx. 1 ms).
Official websites use .gov
A
.gov website belongs to an official
government organization in the United States.
Secure .gov websites use HTTPS
A lock (
) or https:// means you've safely
connected to the .gov website. Share sensitive
information only on official, secure websites.
Recordings of action potentials in bacteria. Two traces for each strain are shown to illustrate the typical shape and size. The shapes are very similar, particularly for spike duration (approx. 1 ms).