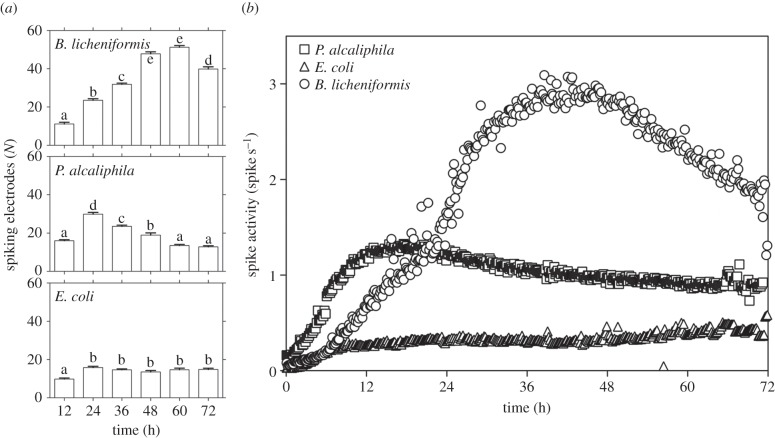
Figure 4.
Number of spiking electrodes recorded during bacterial growth. (a) During the growth of biofilm-forming bacteria, the number of electrodes and, consequently, the number of sites involved in spike recording changes significantly, whereas in E. coli, spikes are detected in almost the same number of sites from the beginning to the end of the 72 h of recording. Means with the same letter are not significantly different from each other (Tukey–Kramer test, p < 0.05). (b) Spike rate during bacterial growth. Each point indicates the mean spike rate value calculated for a time span equal to 10 min. The plot of the spike rate during the growth of biofilm-forming bacteria is a three-zone curve (rapid increase in electrical activity, stationary spike rate, final slow decrease), whereas that of E. coli shows very little variation.

