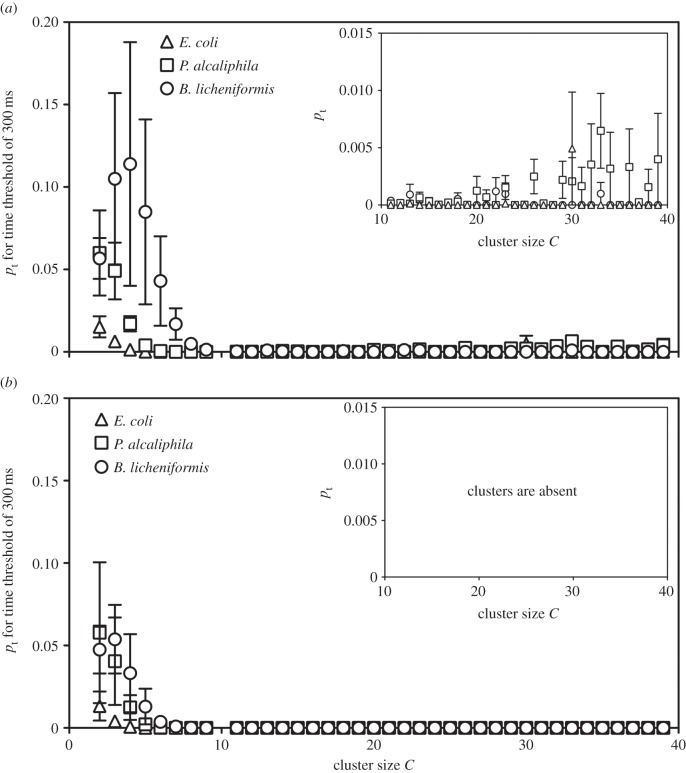
Figure 7.
Distribution of temporal clusters (pt) versus cluster size C for experimental (a) and random data (b) at Δt = 300 ms. In the random data, there is a value of C, defined as Cm, above which no clusters can be observed. In the experimental data, there are some temporal clusters above Cm, indicating the deterministic nature of the data.

