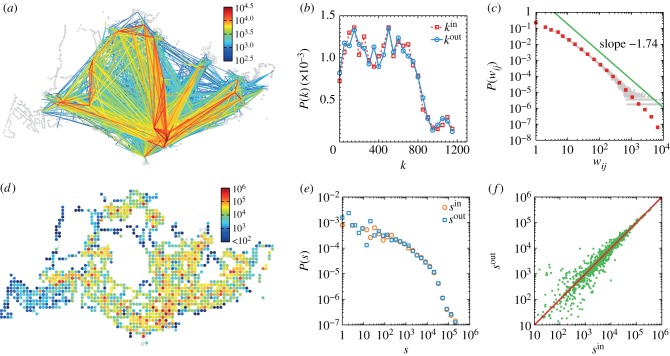
Figure 1.
Structure of intra-urban public transport movements in Singapore. (a) Aggregated spatial interaction network across weekdays (from 19 to 23 March 2012). For simplicity, we only show the top 1% of edges with highest total interaction intensity wij + wji in an undirected manner. The grey markers show the spatial locations of transit infrastructures, including both bus stops (dots) and metro stations (circles). (b) In/out-degree distribution P(kin) and P(kout) measured on the aggregated network. (c) Probability density function P(wij) of interaction intensity across all OD pairs. Grey dots show the original histogram and red squares correspond to a log-binned histogram. As a guide, the green line shows a power law with an exponent β = 1.74. (d) The spatial distribution of total strength  of each cell. (e) Probability density function P(sin) of in-strength and P(sout) of out-strength. Both of them exhibit heavy-tailed properties. (f) Symmetrical plot of sin and sout. Most dots are scattered around the red line, suggesting the homogeneous inflow and outflow spatially.

