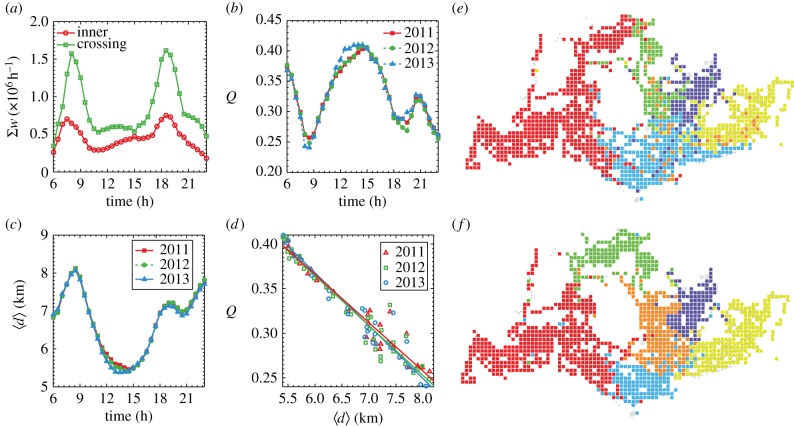
Figure 2.
Structure and temporal variation of intra-urban spatial interactions. (a) Temporal variation of total movements within communities (red-circled line) and across communities (green-squared line) in the year 2012. The summation of these two parts is the total transit flows. (b) Temporal change of modularity Q in 3 years. Modularity Q is characterized by a wave with pronounced troughs (at 08.30 and 19.30) and peaks (at 14.30 and 21.00). (c) Temporal variation of average trip distance  in 3 years. (d) The scatter plot of temporal modularity Q and average trip distance
  . The solid lines represents linear regressions of
  , with α11 = −0.69 ± 0.03, α12 = −0.70 ± 0.04 and α13 = −0.72 ± 0.03 (the subscripts represent years), respectively. (e,f) Community structures identified for 08.30 and 14.30 in 2012.

