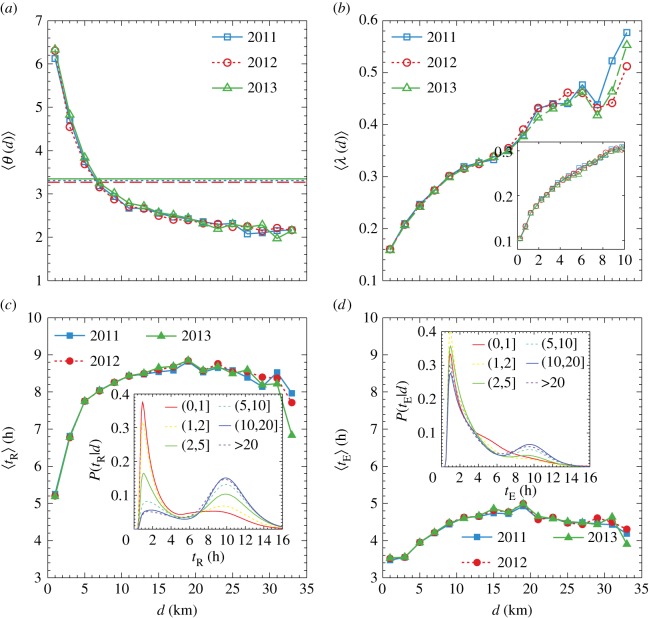
Figure 3.
The impact of distance on spatial interaction patterns. (a) The average diversity index θij with given displacement dij. The dashed line demonstrations a null model assuming that θ is independent of d. (b) The average correlation  with dij. The inset illustrates the change of
  when 0 < d ≤ 10 km. (c) Stay duration tR(d) in between round trips (i, j) and (j, i), averaged over dij for both years. The inset shows the distribution P(tR|d) for groups characterized by different d using kernel smoothing. (d) The same plot as in panel (c), however, for the stay duration tE(d) in between trip chain. The inset shows the corresponding conditional distribution P(tE|d).

