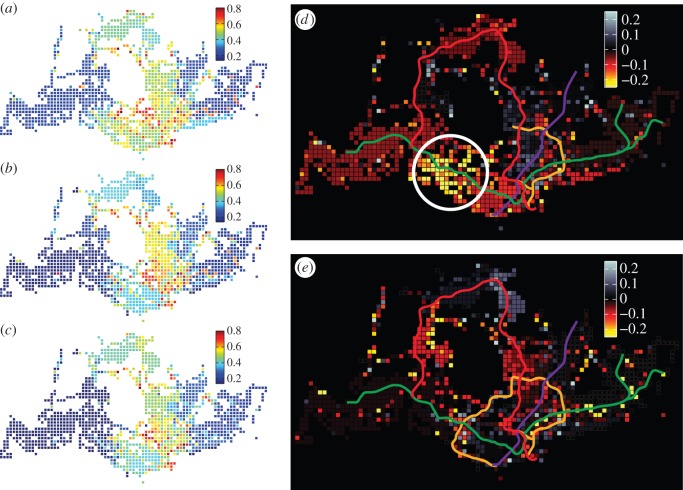
Figure 4.
Spatial distribution of mutability ϕi from 06.00 to 21.00: (a–c) ϕi,11, ϕi,12 and ϕi,13 in the year 2011, 2012 and 2013, respectively. (d) The difference of mutability from 2011 to 2012  . (e) The difference of mutability from 2012 to 2013
  . Given that the full completion of CCL was in October 2011, panel (a) shows the mutability of stage 1 while both (b,c) show the mutability of stage 2. Thus, panel (d) actually shows the change of mutability from stage 1 to stage 2, while both ϕi,12 and ϕi,13 are in stage 2 for panel (e).

