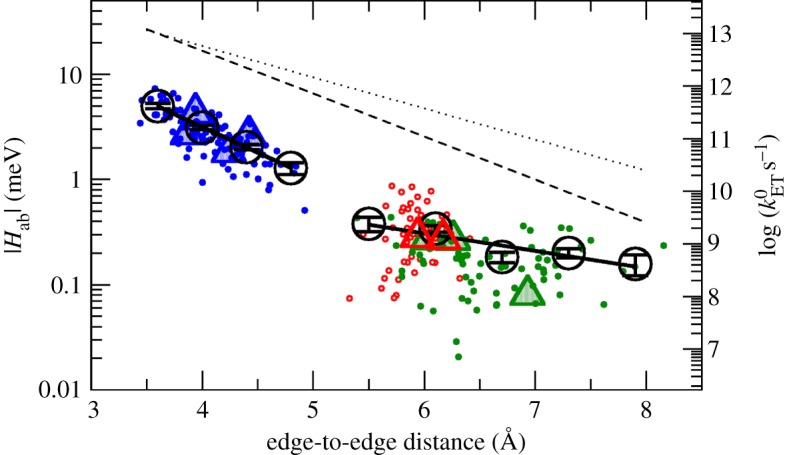
Figure 11.

Thermally sampled couplings (|Hab|, left vertical axis) and resulting maximal ET rates (right vertical axis) for the nine haem pairs in MtrF plotted versus the respective haems' edge-to-edge distance. The colour code corresponds to the three haem pair motifs described in §3: stacked (blue), T-shaped (red) and coplanar (green). Triangles represent couplings obtained for the crystal structure; black circles represent RMS bin averages; black solid lines show exponential fits to the bins; and the dotted and dashed line represent the Moser–Dutton ruler with the default (dotted) and a reduced packing density (dashed), respectively. (Adapted from [115].)
