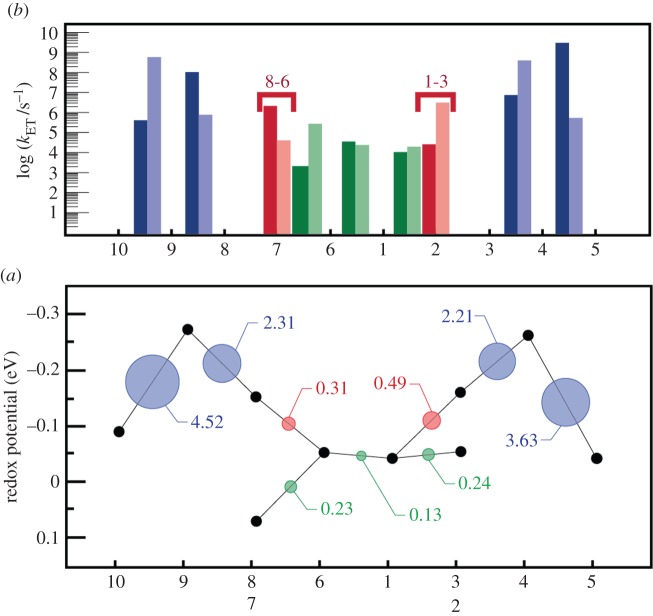
Figure 12.
Kinetics of ET through MtrF as obtained via equation (4.1), and juxtaposition of constituent quantities. (a) Individual ET rates for each pair in forward (left → right, dark bars) and backward direction (right → left, light bars). (b) The free energy landscape for ET through MtrF (as in figure 9) together with the RMS coupling  for each pair (circles, area proportional to the coupling). The colour code of the circles corresponds to the three haem pair motifs as in figure 11. (Adapted from [115].)

