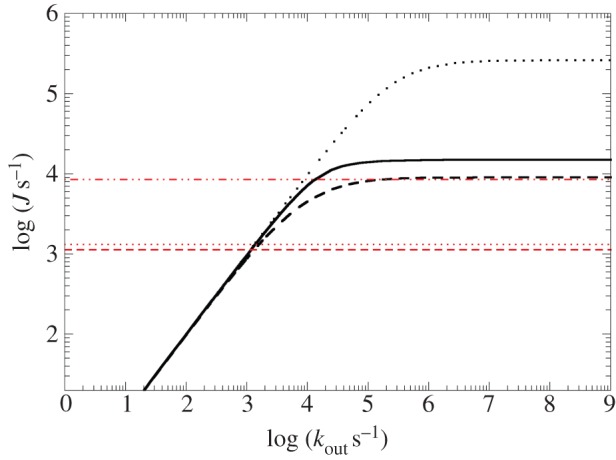
Figure 13.

Modelling of steady-state electron flow J through MtrF based on the individual haem-to-haem ET rates in figure 11 (and as a function of the terminal heterogeneous rate, kout). Black solid line: 10 → 5; black dashed line: 10 → 2; black dotted line: 10 → 7. The red horizontal lines represent experimentally measured electron fluxes through MtrCAB towards different iron oxides (lepidocrocite (dashed dotted), hematite (dotted) and goethite (dashed)). (Adapted from [115].)
