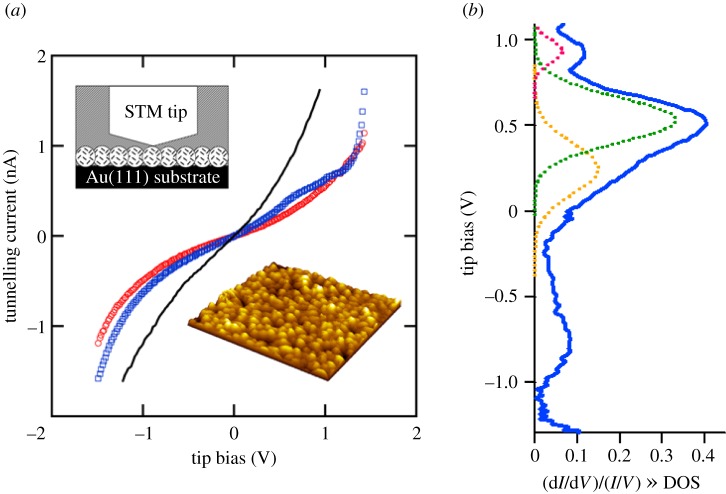
Figure 15.
TS experiments. (a) I–V tunnelling conductance spectra of OmcA (red) and MtrC (blue) single molecules within monolayers (inset) on Au(111) (black) showing deviations from the smoothly varying exponential dependence of the tunnelling probability for MtrC. Redrawn from [150]. (b) The normalized differential conductance from these deviations comprises peaks in the densities of states (DOS) of MtrC at the tip, that can be fit with a vibrationally incoherent electron tunnelling model consistent with participation of haem cofactors assisting the electron conductance. (Adapted from [151].)

