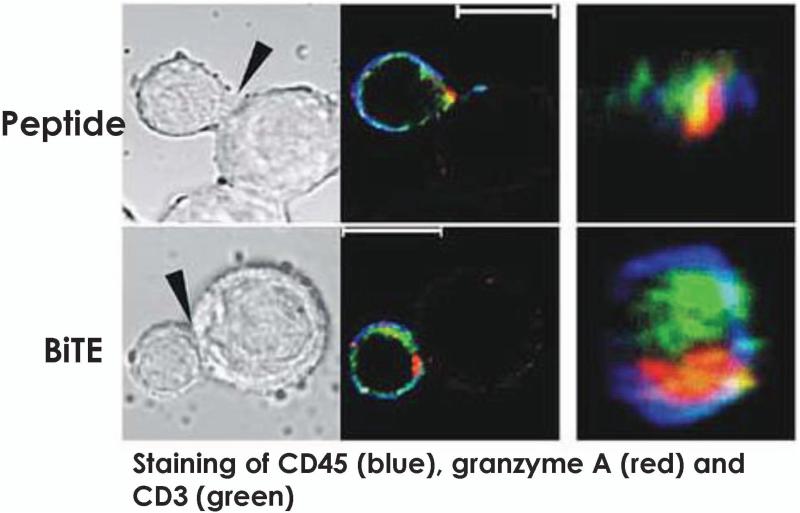
Fig. 4. Confocal imaging of T cell to target cell via BiTEs.
Staining of CD45 (blue), granzyme A (red) and CD3 (green). Results on synapse formation are depicted in this picture. The upper image depict synapses induced by erbB2 peptide while the lower rows show synapses formed in the presence of BiTE. The left columns show the cell conjugates in the differential interference contrast mode; the middle columns show confocal images of immunofluorescence staining of the same cell conjugates. The white bars represent 10 μm. The right columns show the synapse interface. Image reproduced from Molecular Immunology, Volume 43, pages 763-771, Offner S, Hofmeister R, Romaniuk A, Kufer P, Baeuerle PA, 'Induction of regular cytolytic T cell synapses by bispecific single-chain antibody constructs on MHC class I-negative tumor cells,' Copyright 2006, with permission from Elsevier (69).

