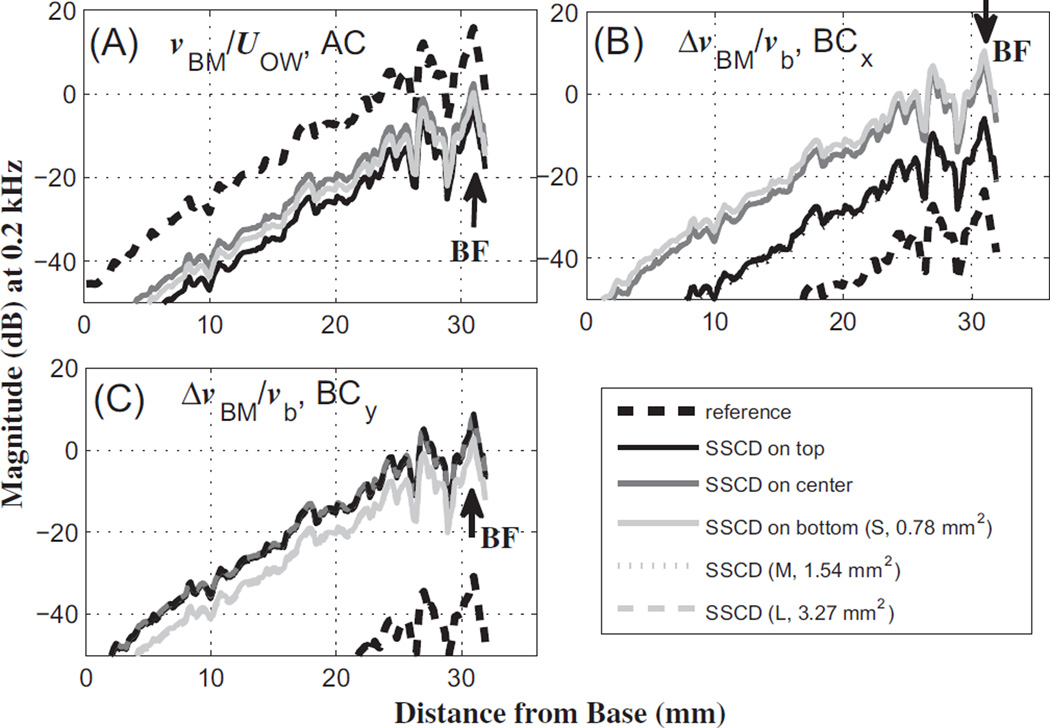
Fig. 5.
BM-velocity profiles along the length of the BM, in response to a 0.2 kHz tone, for (A) air-conducted (AC) input, (B) bone-conducted (BC) input in the x direction (BCx), and (C) BC input in they direction (BCy). The solid lines in different shades indicate the results for the different dehiscence locations from Group I. The different line types represent the results for the varied dehiscence sizes. The BM-velocity responses are normalized by (A) the oval-window volume velocity resulting from AC excitation in the ear canal (UOW), (B) the magnitude of the base bone velocity, vb, given in the x direction, and (C) vb given in the y direction. In addition, vBM indicates the BM velocity, and ΔvBM indicates the differential BM velocity between the BM and the base bone (ΔvBM = vBM – vb). S, M, and L in the legend denote the different dehiscence areas from Group I, 0.78,1.54, and 3.27 mm2, respectively. The effects of dehiscence size on the BM velocity were small enough that the respective lines overlap almost completely. The BF labels represent the best-frequency (BF) position corresponding to the given 0.2 kHz input frequency.

