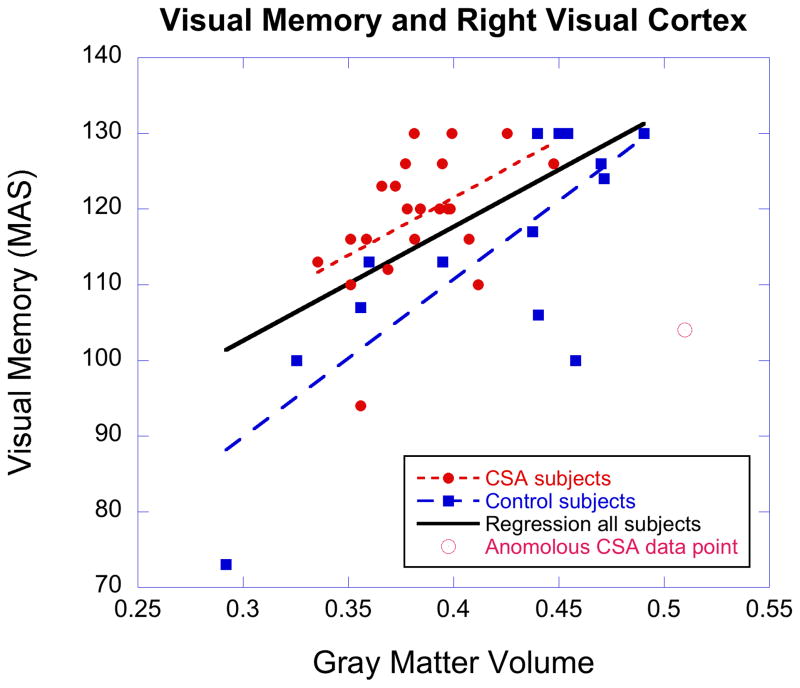
Figure 2.
Scatter plot portraying the relation between gray matter volume and visual memory on the Memory Assessment Scale at the cluster location of maximal correlation in right lingual gyrus (x= 12, y= −85, z= 17). Linear regression for all subjects, and for controls only, shown as solid black line and dashed blue line. Regression in CSA subjects (red dotted line) shown excluding anomalous data point (r = 0.484). There was no significant correlation between visual memory and right V1 GMV in CSA subjects with all points included (r = 0.061).

