
Figure 3.
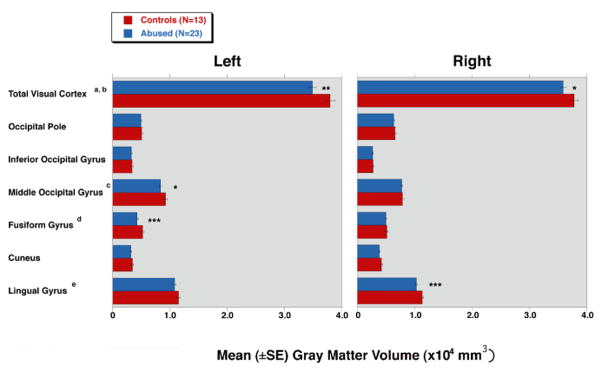
Mean (±SE) gray matter volume (GMV) in the visual cortex acquired by cortical surface-based analysis showing differences between healthy controls and subjects with repeated exposure to childhood sexual abuse. *, P < 0.05; **, P < 0.01; and ***, P < 0.005.
aSignificant difference between two groups in the left visual cortex (abused 34838±627 versus vs. controls 37886±838; F = 8.3, df = 1,34, P = 0.007).
bSignificant difference between two groups in the right visual cortex (35887±518 vs. 37773±693; F = 4.7, df = 1,34, P = 0.038).
cSignificant difference between two groups in the left middle occipital gyrus (8347±243 vs. 9219±325; F = 4.5, df = 1,34, P = 0.041).
dSignificant difference between two groups in the left fusiform gyrus (4285±181 vs. 5226±242; F = 9.5, df = 1,34, P = 0.004).
eSignificant difference between two groups in the right lingual gyrus (10289±179 vs. 11300±239; F = 11.2, df = 1,34, P = 0.002).