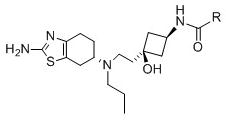
Table 2.
Binding affinities of original lead compound 2 and new compounds 11-23 at the D1-like, D2-like, and D3 receptors in binding assays using rat brain preparation.

| ||||||
|---|---|---|---|---|---|---|
| ligand | R | Ki±SEM (nM) | Selectivity | |||
| D3 | D2-like | D1-like | D2-like/D3 | D1-like/D3 | ||
| 2 |

|
0.40±0.087 | 725±45 | 1,610±167 | 1,827 | 4,025 |
| 11 |

|
0.74±0.038 | 224±9 | 1,970±179 | 301 | 2,662 |
| 12 |

|
0.62±0.068 | 72±11 | 49,700±2,807 | 117 | 80,161 |
| 13 |

|
0.58±0.062 | 101±12 | 28,700±2,640 | 175 | 49,482 |
| 14 |

|
1.6±0.19 | 244±46 | 15,113±780 | 157 | 9,751 |
| 15 |

|
0.46±0.06 | 17,000±4,092 | 53,600±8,380 | 36,956 | 116,521 |
| 16 |

|
1.9±0.087 | 264±46 | 56,600±2,730 | 138 | 29,789 |
| 17 |

|
0.89±0.17 | 367±27 | 50,000±4,890 | 412 | 56,180 |
| 18 |

|
0.43±0.06 | 6,950±1,095 | 28,200±5,308 | 16,272 | 65,581 |
| 19 |

|
1.0±0.094 | 158±25 | 43,500±711 | 160 | 44,500 |
| 20 |

|
0.70±0.055 | 2,660±461 | 42,800±3,279 | 3,779 | 61,143 |
| 21 |

|
0.76±0.036 | 9,790±1,500 | 64,200±1,760 | 12,836 | 84,474 |
| 22 |

|
0.96±0.10 | 14,600±1,280 | 19,200±2,550 | 15,208 | 20,000 |
| 23 |

|
0.53±0.07 | 15,800±5,910 | 15,000±2,920 | 29,800 | 28,300 |
D3 receptor binding was determined using [3H]7-OH-DPAT and membranes prepared from ventral striatum.
D2-like receptor binding (D2, D3, and D4) was determined using [3H]spiperone and striatal membranes. D2-like receptor binding (D2, D3, and D4) was determined using [3H]spiperone and striatal membranes. For those compounds that produced a competition curve consistent with inhibition at 2-sites in this assay, which is consistent with the behavior of agonists in this assay, the Ki value for the high affinity component is reported. D1-like receptor binding (D1 and D5) was determined using [3H]SCH23390 and striatal membranes.
Data are the mean ± SEM of 3–6 independent determinations.
