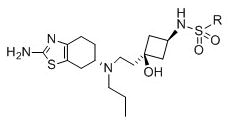
Table 3.
Binding affinities of new compounds 24-35 at the D1-like, D2-like, and D3 receptors in binding assays using rat brain preparation.

| ||||||
|---|---|---|---|---|---|---|
| Ki±SEM (nM) | Selectivity | |||||
|
|
||||||
| ligand | R | D3 | D2-like | D1-like | D2-like/D3 | D1-like/D3 |
| 24 |

|
1.9±0.17 | 81±11 | 57,000±2,830 | 42 | 30,000 |
| 25 |

|
2.3±0.22 | 170±18 | 1,810±93 | 75 | 800 |
| 26 |

|
1.6±0.16 | 160±8.5 | 36,500±2,243 | 98 | 22,812 |
| 27 |

|
1.6±0.090 | 102±15 | 2,610±255 | 65 | 1,631 |
| 28 |

|
0.59±0.057 | 286±49 | 94,900±7,620 | 485 | 160,847 |
| 29 |

|
2.5±0.15 | 71±4.8 | 68,000±2,300 | 28 | 27,200 |
| 30 |

|
2.6±0.20 | 542±79 | 45,900±2,490 | 205 | 17,654 |
| 31 |

|
1.0±0.072 | 619±68 | 109,000±2,500 | 614 | 109,000 |
| 32 |

|
1.2±0.091 | 110±14 | 117,000±10,170 | 91 | 97,500 |
| 33 |

|
1.9±0.25 | 789±36 | 102,000±5,390 | 414 | 53,684 |
| 34 |

|
2.3±0.25 | 2,420±118 | 41,900±2,764 | 1,052 | 18,217 |
| 35 |

|
3.1±0.26 | 57±7.4 | 76,000±6,810 | 19 | 24,516 |
D3 receptor binding was determined using [3H]7-OH-DPAT and membranes prepared from ventral striatum.
D2-like receptor binding (D2, D3, and D4) was determined using [3H]spiperone and striatal membranes. D2-like receptor binding (D2, D3, and D4) was determined using [3H]spiperone and striatal membranes. For those compounds that produced a competition curve consistent with inhibition at 2-sites in this assay, which is consistent with the behavior of agonists in this assay, the Ki value for the high affinity component is reported. D1-like receptor binding (D1 and D5) was determined using [3H]SCH23390 and striatal membranes.
Data are the mean ±SEM of 3–6 independent determinations.
