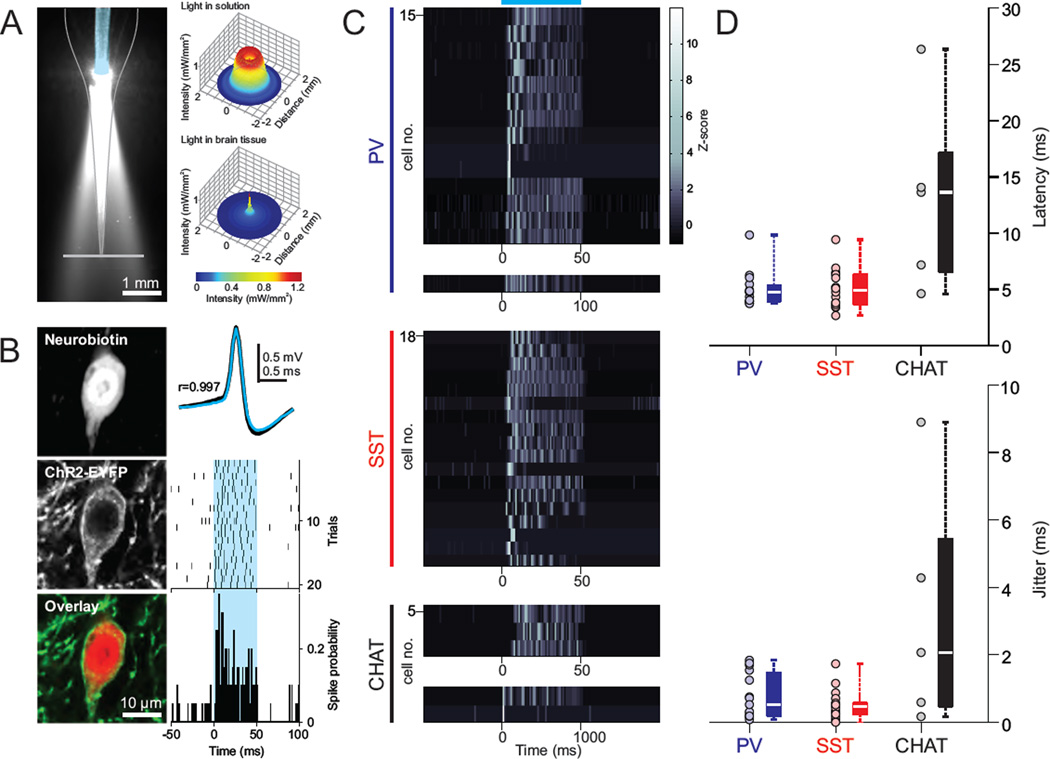
Figure 2. Optical activation of genetically defined, ChR2-expressing neurons.
(A) Cone of blue light emitted by the optical fiber (blue false color) located inside of the glass pipette. Right top, cross-sectional light intensity profile (source: blue 473 nm laser light) at the pipette tip, estimated from the light power measured along the gray plane in the left image (75 mW·mm−2 at tip of fiber). Right bottom, estimation of light intensity at the tip of pipette inside the brain. Light intensity is corrected for power attenuation due to scattering, geometric dispersion and distance from light source (Stark et al., 2012). (B) Representative example of light-evoked activity for a post hoc histologically verified ChR2-expressing cortical interneuron in the PV-Cre driver line. Left, fluorescence and merged images of the neurobiotin staining and ChR2 expression of the recorded cell. Right top, spontaneous (black) and light-evoked (light blue) spike waveforms are highly correlated (Pearson correlation coefficient, r = 0.997). Raster (middle) and peristimulus histogram of spike probability (bottom; bin: 1 ms) for 20 trials of light stimulation of the recorded cell. Blue shaded area represents light stimulus. (C–D) Z-scored peristimulus histograms, latency and jitter to first spike of all histologically verified ChR2-expressing cells in the PV, SST and CHAT Cre driver lines. Light stimulation intensity (at pipette tip): 0.9–1.4 mW·mm−2. Box plot central bar represents the median, and edges represent the 25th and 75th percentiles of the data set. Blue horizontal line represents light stimulus.

