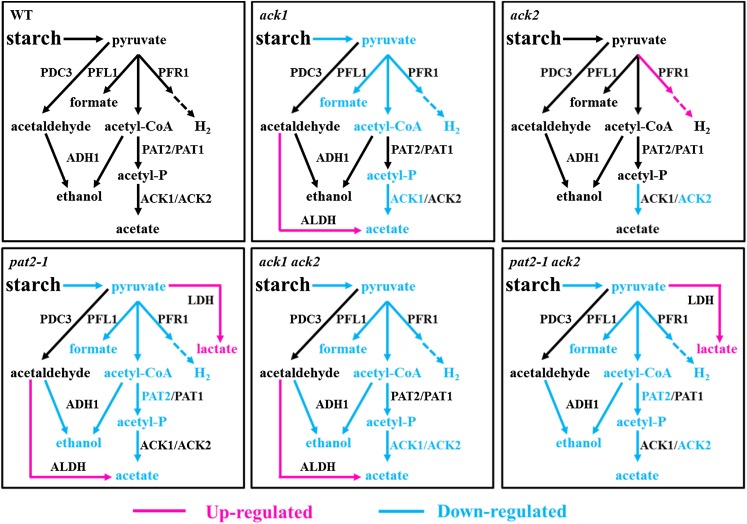
Figure 11.
Modulation of Anoxic Pathway Activities in Single and Double ack/pat Mutants.
Summary of altered metabolic pathway activities in the indicated mutants relative to the wild-type control strain. Blue represents attenuated pathway activities in the respective mutants; red represents increased pathway activities in the indicated mutants; dashed arrows represent catalytic steps that were omitted in the transfer of electrons from PFR1 to the hydrogenases.

