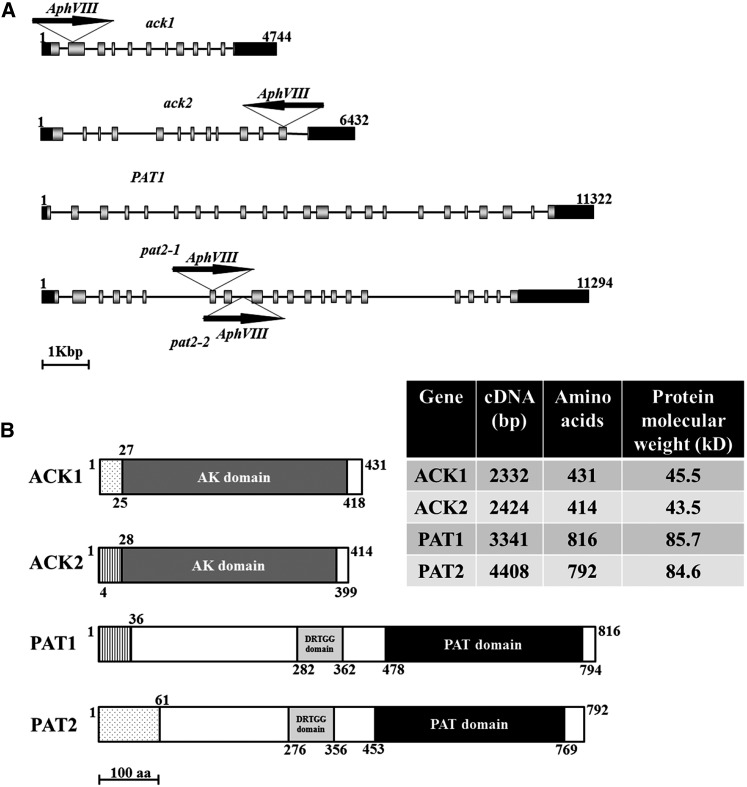
Figure 2.
ACK and PAT Genomic Sequences and Protein Domains.
(A) ACK1, ACK2, PAT1, and PAT2 genes and the positions of insertions in the ack1, ack2, pat2-1, and pat2-2 mutants. Arrows indicate the orientation of the insertion. Black boxes represent 5′ and 3′UTRs, and gray boxes and black lines represent exons and introns, respectively. The numbers represent the size, in base pairs, of the genomic DNA.
(B) Predicted ACK1, ACK2, PAT1, and PAT2 protein domains. The white boxes indicate the segments of ACK and PAT that have not been specifically associated with a function/domain. The acetate kinase (AK), phosphate acetyl/butyryl transferase (PAT), and DRTGG domains are indicated. The lightly stippled boxes in ACK1 and PAT2 represent chloroplast transit peptides, whereas in ACK2 and PAT1, vertical lines represent mitochondrial presequences. The numbers along the length of the proteins represent amino acid positions. aa, amino acids.

