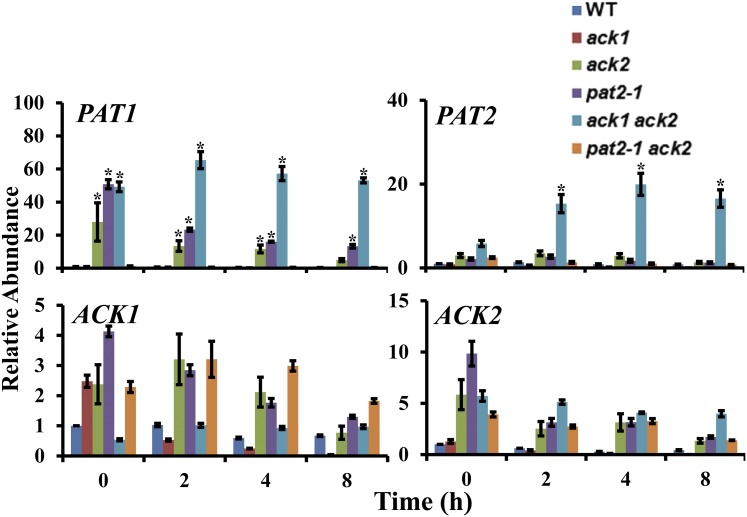
Figure 6.
Changes in ACK and PAT Transcript Abundances in ack and pat Mutants.
RT-qPCR was used to assess ACK and PAT transcript levels in the wild type, the ack1, ack2, and pat2-1 single mutants, and the ack1 ack2, pat2-1 ack2 double mutants under dark anoxic conditions. The T0 time point represents the time prior to anaerobic induction (oxic samples). Absolute quantifications were performed; expression levels are presented relative to gene expression at 0 h. Errors bars represent sd. Asterisks represent significance (Student's t test, P < 0.01).

