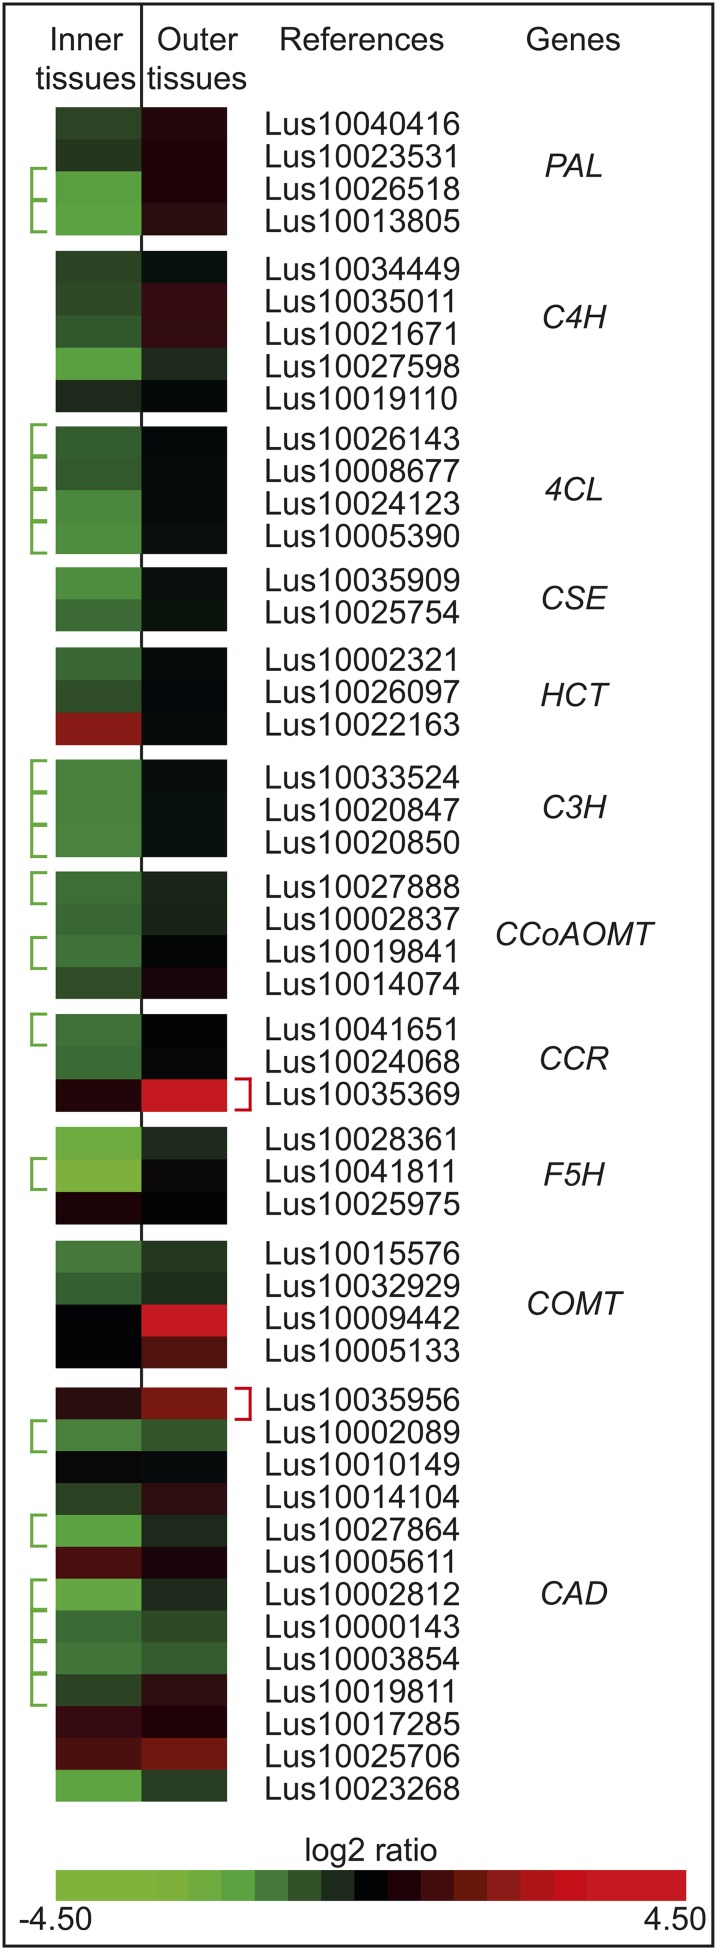
Figure 10.
Heat Map Representing Comparative Accumulation of Monolignol Biosynthetic Transcripts in Outer- and Inner-Stem Tissues of lbf1.
Transcripts annotated by a bracket are significantly overaccumulated (red) or underaccumulated (green) (P value < 0.05, Bonferroni method) in the mutant compared with the wild type.

