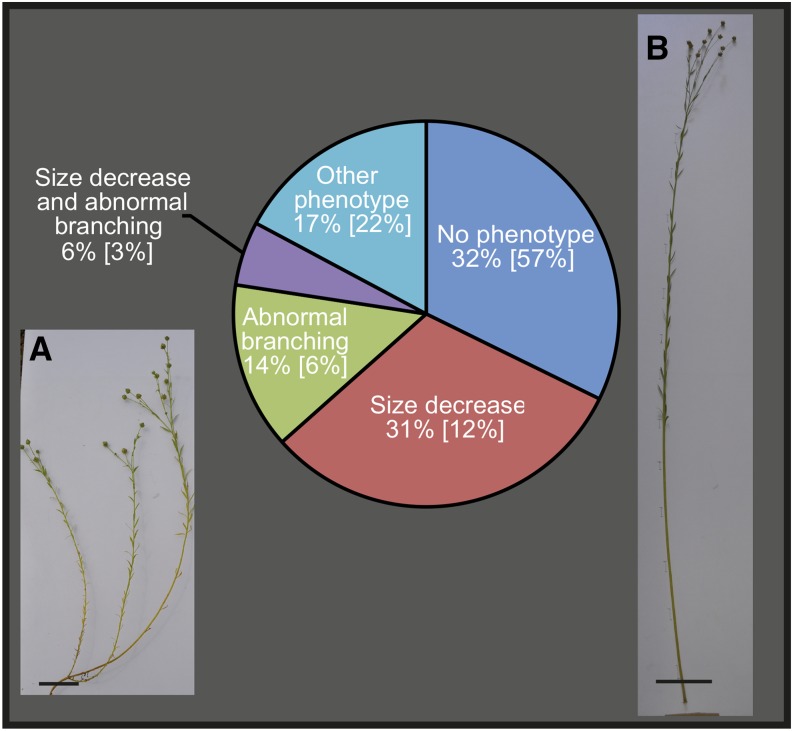
Figure 2.
Proportion of Flax lbf Mutants in Different Categories Based on Visual Phenotype.
Percentage values refer to the proportion of lbf mutants showing a given phenotype. Values in brackets correspond to the proportion of all flax mutants (PT-flax collection) showing the phenotype.
(A) Photo of typical lbf mutant showing reduced size and increased branching. Bar = 5 cm.
(B) Photo of wild-type flax plant. Bar = 10 cm.
[See online article for color version of this figure.]

