Figure 8.
Sugar and Protein Analyses in lbf1 Inner- and Outer-Stem Tissues.
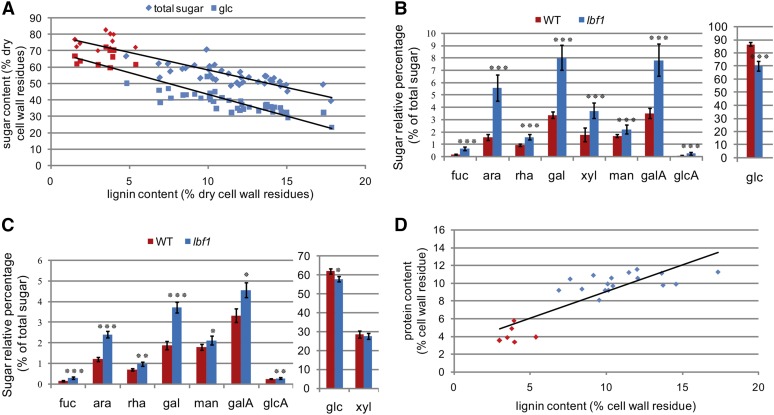
(A) Relationship between sugar content and lignin content in outer tissues of wild-type and mutant plants. Diamond-shaped dots correspond to total sugar content and square dots correspond to glucose content (red, wild-type plants; blue, lbf1 mutants).
(B) Relative content of different sugars in outer tissues of wild-type and lbf1 mutants. Glucose content is separated from other sugars due to the scale difference.
(C) Relative amounts of different sugars in inner tissues of wild-type and lignified mutants. Glucose and xylose are separated from others sugars due to the scale difference.
(D) Relationship between lignin and protein content. Lignin content was determined by acetyl bromide and protein content by nitrogen dosage (red, wild-type plants; blue, lbf1 mutant plants).
For (B) and (C), significant differences (Student’s t test) between the wild type and mutant were observed at P < 0.001 (***), P < 0.01 (**), and P < 0.05 (*). Error bars = sd.

