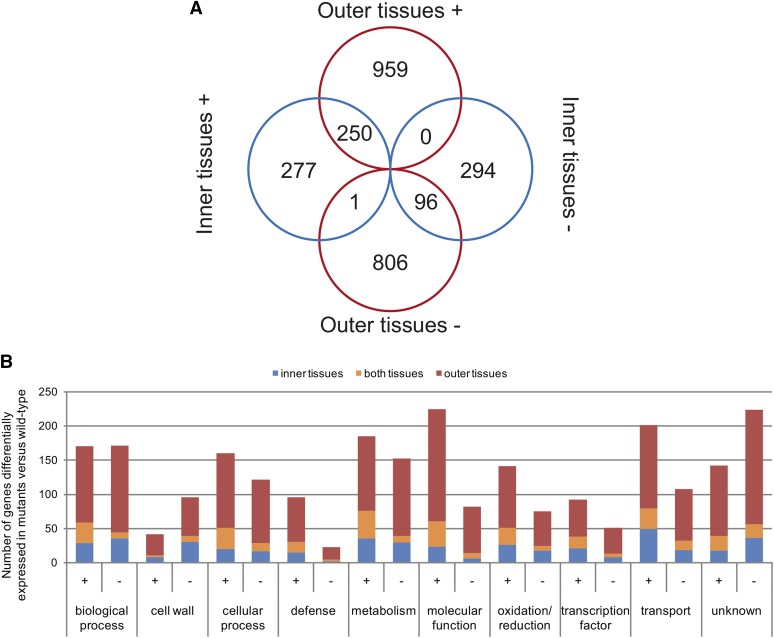
Figure 9.
Differentially Accumulated Transcripts in lbf1 Mutants versus the Wild Type in Separated Tissues.
(A) Venn diagram; ±, over/underaccumulated (P value < 0.05, Bonferroni method) transcripts in lbf1 stem tissues versus corresponding tissues of the wild type.
(B) GO classification of differentially accumulated transcripts in outer (red), inner (blue), and both (orange) tissues. GO classification was determined using blast2go on protein sequences (NCBI) and verified by expert curation.

