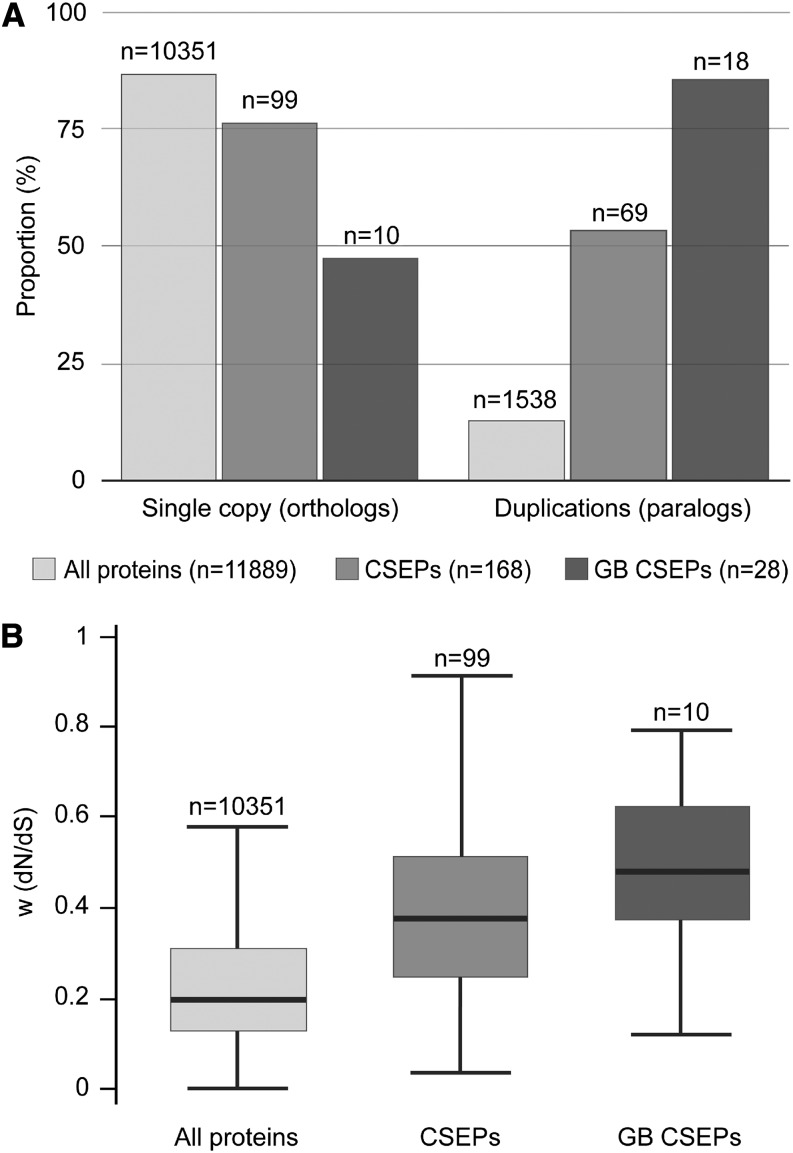
Figure 11.
Evolutionary Analysis of M. perniciosa Candidate Effectors.
(A) Percentage of orthologs and paralogs in all protein-encoding genes, CSEPs, and green broom (GB) CSEPs. CSEP genes are significantly enriched for paralogs in relation to all protein-encoding genes, and green broom CSEP genes are significantly enriched for paralogs in relation to CSEP genes.
(B) dN/dS ratio box plots showing medians and quartiles of values for the set of orthologous protein-encoding genes, CSEPs, and green broom CSEPs. CSEP genes are significantly enriched for higher dN/dS rates in relation to all protein-encoding genes, and green broom CSEP genes are significantly enriched for higher dN/dS rates in relation to CSEP genes.

