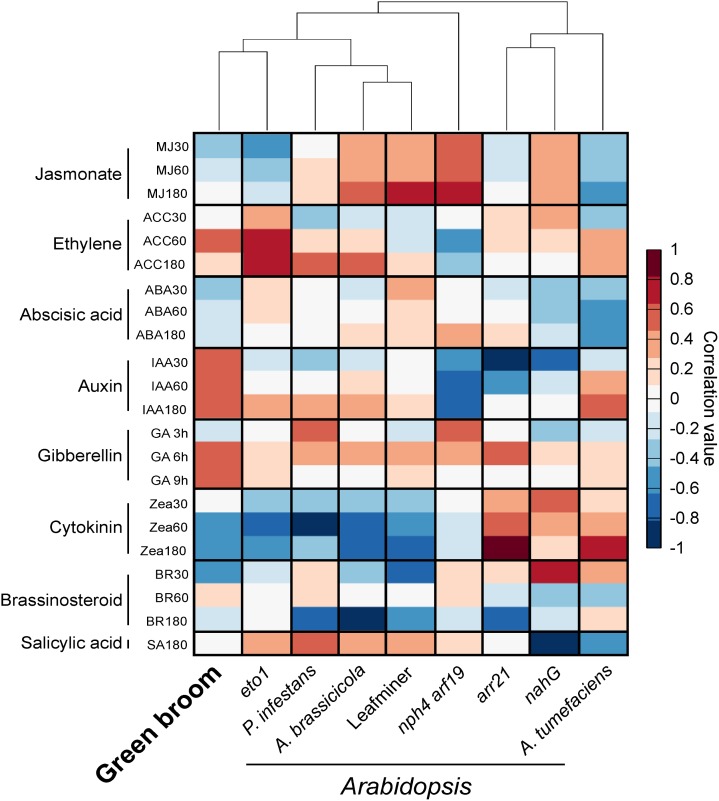
Figure 5.
Identification of Hormonal Signatures Based on Transcriptomic Data.
The analysis was conducted using the HORMONOMETER software, which compares gene expression data of a query experiment with data sets of hormone responses. Transcriptomes of Arabidopsis mutants with known alterations in hormonal responses were used as controls (arr21, increased cytokinin response; eto1, increased ethylene response; nahG, reduced salicylic acid levels; nph arf19/IAA, reduced auxin signaling). We also included transcriptomes of Arabidopsis interacting with other organisms (Agrobacterium, 6 d after infection; P. infestans, 24 h after infection; A. brassicicola, 24 h after infection; and the leaf miner insect L. huidobrensis, locally damaged leaves). A positive correlation between the query transcriptome and a hormone treatment is denoted in red, whereas a negative correlation is represented by blue.

