Figure 1.
Genetic Interaction between SYP22 and FAMA.
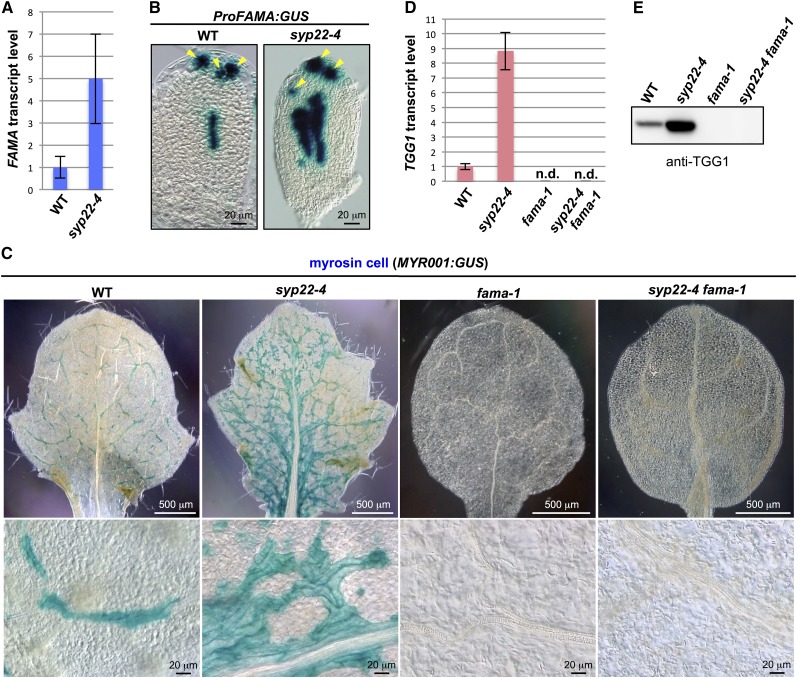
(A) Quantitative RT-PCR of FAMA in 21 DAG plants of the wild type (WT) and syp22-4. Actin2 was used as a control. Error bars indicate sd (n = 3).
(B) GUS staining of rosette leaves of wild-type and syp22-4 plants expressing ProFAMA:GUS. Arrowheads indicate stomatal lineage cells. Bars = 20 μm.
(C) GUS staining of rosette leaves of wild-type, syp22-4, fama-1, and syp22-4 fama-1 plants expressing myrosin cell marker MYR001:GUS. Lower panels are enlarged images of upper panels. See Supplemental Figure 3 for GUS staining of whole plants. Bars = 500 μm (top panels) and 20 μm (bottom panels).
(D) Quantitative RT-PCR of TGG1 in 21 DAG plants of the wild type, syp22-4, fama-1, and syp22-4 fama-1. Actin2 was used as a control. Error bars indicate sd (n = 3).
(E) Immunoblot analysis of rosette leaves of the wild type, syp22-4, fama-1, and syp22-4 fama-1 using anti-TGG1 antibody.

