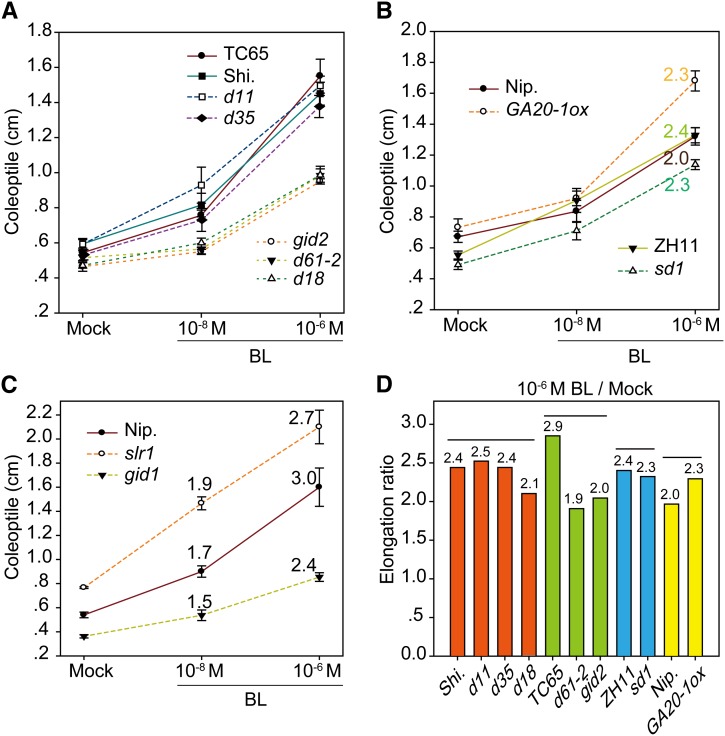
Figure 3.
Coleoptile Elongation of GA-Related Mutants in Response to BR.
(A) to (C) Plants were grouped by different backgrounds or independent experiments. Dashed lines indicate mutants. Numbers indicate elongation ratios in (B) and (C). Error bars indicate sd (n = 8 for slr1, gid1, and gid2; n = 15 for others).
(D) Elongation ratios at 10−6 M BL as analyzed in (A) and (B). Top lines and colors indicate groups classified with different backgrounds.

